Mobile game analytics can feel complicated. When it comes to metrics, there are hundreds of numbers to track. On the simpler end of the spectrum, there are metrics like downloads, sessions, and DAUs. These numbers are relatively straightforward and measure concrete actions. More complicated metrics includes things like churn, Average Revenue Per Paying User (ARPPU) and DAU/MAU. These are less intuitive to interpret, and they might raise more questions than answers.
"Am I waiting the right amount of time until I consider a user churned?"
"What is a good ARPPU?"
And we haven't even introduced more advanced analytics concepts like segmentation, funnels and custom events! For now, we'll stick to just the metrics and look at what these numbers actually tell you about your game. While there's no one-size-fits-all policy for game analytics, there are some useful metrics that can help shed light on how you can improve your mobile game.
Daily Active Users (DAUs)
Starting with the basics, DAU is the number of unique users that start at least one session in your app on any given day. By themselves, DAU and other high level metrics don't provide much insight into an app's performance. However, knowing these simple metrics is a useful starting point for an educated analytics discussion.
Let's look at an example. Take a hardcore game that has 10,000 engaged users. These users all play the game several times each day and actively monetize. Compare that to a news or messaging app that has 1,000,000 DAUs but no monetization mechanics. A third app that has poor retention might run a user acquisition campaign. Today they have 500,000 DAUs, but tomorrow they are down to 100,000. A DAU count is merely a snapshot in time, and the surrounding context can be just as important, if not more important, than a large user base.
Sessions
Every time any user, not just a unique user, opens your app, that counts as a session. Similar to DAUs, the total number of sessions requires some context to be a helpful number. Specifically, focus on the average number of sessions per DAU, as this metric can tell you about how engaged users are with your game.
An app's genre does have an effect on Sessions/DAU, as some game styles lend themselves to more frequent sessions. However, if users are coming back five to ten times each day, it's safe to assume they enjoy the game. If users only open an app one to two times per day, it is unlikely to keep their attention for long.
DAU/MAU
The ratio of Daily Active Users to Monthly Active Users shows how well an app retains users and is often referred to as the stickiness of a game. This metric shows you how frequently users log in to your app. This metric will be easier to discuss with an example.
Let's say an app has 100,000 MAU and averages 15,000 DAU. Then, the DAU/MAU ratio would be 15 percent. This means that the average user logged in on roughly 15 percent of the days that month.
Since this is a ratio, the metric DAU/MAU can only be a value between zero and one. Values closer to one, mean users are opening the app on a higher percentage of days. Popular social networking apps like Facebook have reported DAU/MAU ratios as high as 50 percent. But most successful gaming apps have ratios closer to 20 percent.
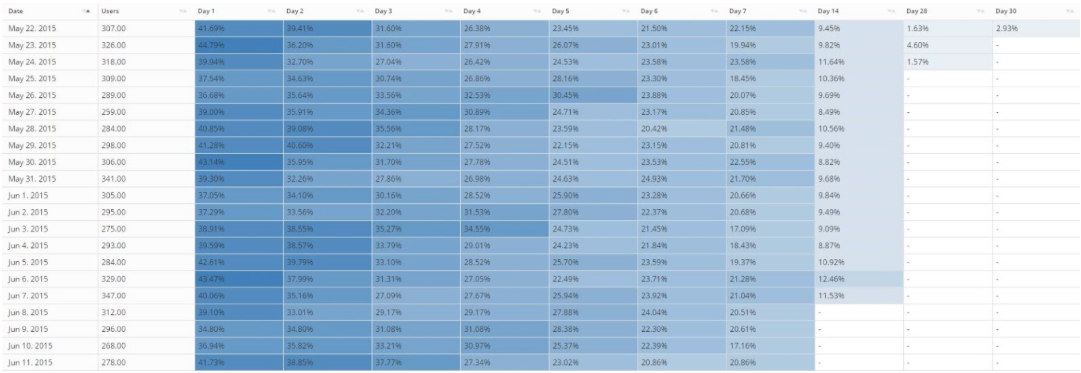
Retention
Retention is arguably the most important metric in a free-to-play game. Successful free-to-play games create long-term relationships with users. Users that enjoy the experience enough are willing to pay to for a competitive advantage. A game needs to have strong retention to have time to build this relationship.
To calculate retention, separate your users into cohorts based on the day they download your app. The day that the download occurs is Day 0. If a user opens your app the next day (Day 1), they are marked as retained. If they do not open the app, they are not retained. This calculation is performed for user cohort on each day after they download the app. Common days used for retention are 1, 3, 7 and 30.
Conversion Rate
Moving right along to everyone's favorite topic: money! The above metrics focus on measuring your relationship with your users. How often do they come back to your app? But the most important metric for many indie developers is whether their game is making enough money.
The conversion rate measures the percentage of unique users that have made a purchase out of the total number of users during that time period. You can also measure the conversion rate of ads served in a free-to-play game.
Getting a user to pay real money in a game that they can play for free is a difficult assignment. But, as with many other industries, repeat purchasers generate the majority of revenue in free-to-play games. Encourage users to make that first conversion by offering them a virtual item of incredible value.
ARPDAU
The Average Revenue Per Daily Active User, or ARPDAU, is one of the most commonly discussed metrics in mobile games. ARPDAU is a useful metric because it allows you to understand how your game performs on a daily basis.
This is a great metric to track before and during user acquisition campaigns. Before acquiring users, make sure you know the range of your ARPDAU and how it fluctuates normally. During a campaign, segment your new users by source and see which networks or games perform the best in your app. We'll discuss segmentation in a later post.
ARPPU
Average Revenue Per Paying User (ARPPU) measures only the subset of users who have completed a purchase in a game. This metric can vary dramatically based on game genre. Hardcore games tend to have higher monetization metrics like ARPPU, but they also lack the mass appeal of more casual games.
Churn
Churn is roughly the opposite of retention. How many players that downloaded your game are no longer playing? The churn metric makes the most sense in a subscription business model and there are some nuances involved when applying it to free-to-play games.
The main consideration is user play style. With a subscription service, churn is black and white. Either a user is paying or they are not. In a free-to-play game some users may play multiple times per day, while more casual players log in once or twice a week. To generalize for these differences between users, we measure churn as a user who has not played in 28 days.
In-Game Metrics
Beyond understanding user engagement, retention and monetization, it is important to measure and balance the game economy. If it is too easy to earn virtual currency, users have no reason to monetize. But users still need enough currency to enjoy and explore the game. There is a happy medium somewhere in between, and the following metrics can help find it.
Source, Sink and Flow
Sources are places where users can earn virtual currency. In the GameAnalytics dashboard, the source metric measures the amount of currency a user has earned. It also includes any currency he or she has generously been given by you, the benevolent game designer.
A sink is the opposite of a source. These are the locations in your game where users spend their precious currency. Both sources and sinks can refer to premium (hard) and secondary (soft) currencies. Keep these different types of currencies separate during your analysis.
Combining sources and sinks gives you the flow. Flow is the total balance of currency that your players have spent and earned. Generally the flow should look stable like in the chart below.
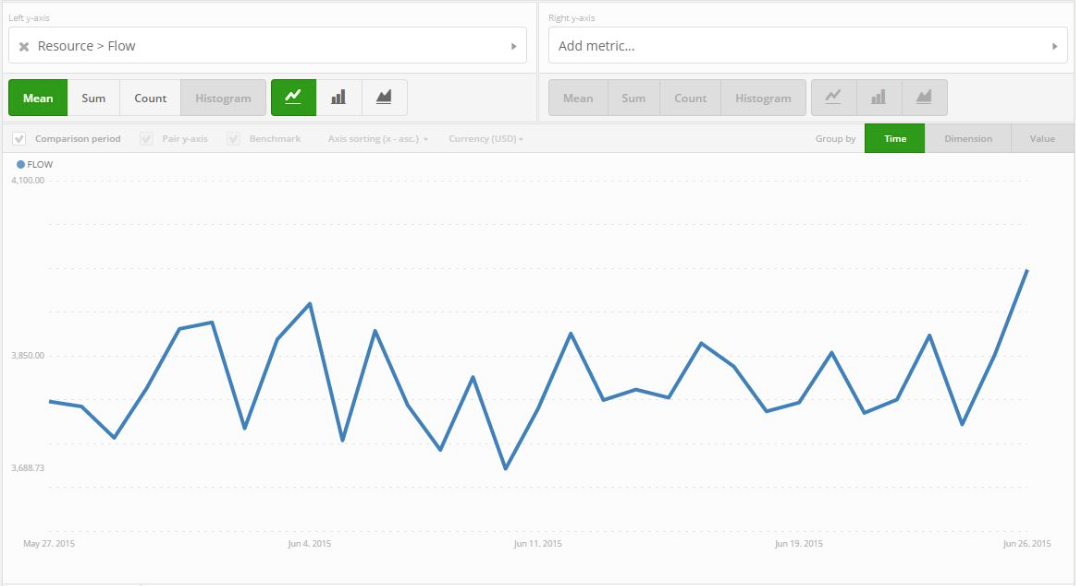
If the chart skews upward like an exponential curve, your player base will have too much currency and no need to monetize. If the chart slopes negatively to zero, players won't have enough resources to do anything in your game.
Start, Fail and Complete
Lastly, we will look at some progression metrics. Whether or not the user has to explicitly start a new level, many game types have a leveling component. Starts measure the number of times a player starts a new level.
Second in the creatively named metrics category are fails. A fail occurs when a user starts a level but does not complete it.
As you might expect, a complete counts the number of times users complete a certain level. Tying all three of these together helps you analyze the levels in your game.

Are your choke points appropriately difficult? Are users getting stuck on certain levels unexpectedly? Which levels are users having the most fun playing and repeating? Starts, fails and completes can answer these types of questions.
While there is no magic recipe for game analytics, the above metrics are standards that can help you get started in the world of analytics. The most important part of mobile game analytics is to get started and establish benchmarks for your own games. Once you understand how your users behave, you can measure things like the impact of a game update or changes to your user acquisition strategy.
Originally posted on the GameAnalytics blog.


Great introductory article, sheds light on basics of KPIs.