So, how do you go about developing your projects? If you're anything like me (until recently) then you will have just worked out what you need to do, and then got on with it - picking and choosing at tasks in some sort of correct order, and working from the foundations upwards. Whilst there isn't anything particularly wrong about this method, it's hardly an efficient and quick method of completing the project. In this article I'm going to cover a method that will help you complete your project in the most time-efficient manner.
The first time you get the feeling that the first method (the 'Old' one) doesn't work is when you forget to do something and have to go back and do it - pausing all other development in the process. This is particularly bad when working as a team. If this happens you may be working your socks off trying to correct what you missed whilst the rest of your team are twiddling their thumbs because they can't do anything till you've finished. If you'd planned it properly you could have gotten someone who wasn't busy earlier on in development to do it, while you (and others) were still working on other things.
By the end of this short guide you'll be able to work out, in almost no time at all, the quickest and most efficient route to completion.
[size="5"]
Critical Path Analysis: Step 1
The first step to using critical path analysis is to set out the activities that must be completed in order for the project to be completed. If we take a simple game framework it might look something like this:
[bquote][A] Graphics Engine
[array='B'] Sound Engine
[C] Music Engine
[D] Input Engine
[E] Gameplay/general programming
[F] Physics
[G] 2D Artwork
[H] 3D Artwork
[array='I'] Sound effects
[J] Music recording
[K] Level Design[/bquote]Anyone who's completed a game will probably realise that there's much more to it than the above list, but this is only an example - and it can easily be extended. You could go as far as doing a separate analysis for the development of the graphics engine. It's only limited to the detail that you include.
[size="5"]
Critical Path Analysis: Step 2
Now that you know what activities you must complete in order to complete the project you need to decide what dependencies there are. This will involve creating a hierarchy for the activities - what activities must be completed before you can start this activity? Notice that the original list (in Step 1) has a letter for each activity. This is just for convenience. Later on when you start drawing out diagrams it'll get a little crowded and complicated to put the complete activity name in, so we're referring to them by letter.
[bquote][A] depends on:
[array='B'] depends on: I
[C] depends on: J
[D] depends on: A
[E] depends on: B, C, D
[F] depends on: E
[G] depends on:
[H] depends on: G
[array='I'] depends on:
[J] depends on:
[K] depends on: F[/bquote] The above list is what I think the dependency list should look like. You may well disagree, but you can change it all around when we're done. Notice that [K] only depends on [F]. You may be thinking that level design doesn't only require physics to be completed - it requires almost everything else to be completed as well. But if you look closely, [F] requires that [E] is completed, and [E] can't be completed until almost everything else has been. Therefore [F] effectively implies that everything before it has been completed - in this case [E], so Level Design (K) does actually require that (almost) everything else is completed.
[size="5"]
Critical Path Analysis: Step 3
You're now starting to get a clearer picture of what will need to be done to complete your project efficiently. However this is still very murky compared with the final result. This step is the beginning of things getting complicated> In this step we must draw a graph.
But this isn't quite like the normal graphs you're used to - bar charts, scatter diagrams and so on. This graph doesn't represent a series of data. If you've done much discrete mathematics/path finding algorithms the chances are that you'll know most of this - feel free to skip forward. The rest of you will need a quick crash-course in graph theory. A graph as we're using it can also be referred to as a network - a series of points (nodes or vertices) connected by lines (arcs or edges). Nodes represent events, positions (of buildings for example) and the edges represent a path between them (a road for example). Edges are normally straight lines (and don't actually represent the real-world path). For Critical Path Analysis we'll be using a digraph - a graph with directed edges. These edges will have an arrowhead on them indicating that you can only 'travel' in that direction along the edge. Finally, a couple of conventions: 1) where possible edges should not cross each other, 2) for Critical Path Analysis graphs time is represented across the graph from left-right, it's not fixed to any scale; all it really means is that the start is on the left and the finish is on the right.
Bet that was confusing! It's best if you look at an example graph now. The following diagram is basically the dependency list (Step 2) converted into a graph.
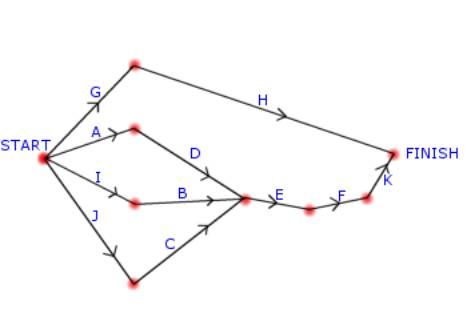
Not too complicated really, but trust me - they can get unbelievably complex in some cases. Each of the edges in the above graph represent an activity (or task): the red dots (nodes) represent the completion of that task, and they also represent a junction - where you can possibly enter/exit from multiple routes. The length of the edges isn't important, nor is the positioning of the vertices; just juggle it around till it fits together nicely.
[size="5"]
Critical Path Analysis: Step 4
You're starting to get somewhere now, but you need to put some information on your graph. Currently all it represents is the dependency list, and you require more. The first step is to add the activity lengths. This is very ambiguous - how can you tell how long it takes to develop the graphics engine? You can take a good guess - but you can't always be sure, especially if you are part of a part-time team (where you don't always do an 8 hour working day for example). The algorithm does take this into account though - events that are important (on the critical path) will dictate the length of the project, so if one activity on it is delayed the whole project is delayed.
The following list is my estimation for the length of time (in days) that it will take to complete each activity. The predictions made here will be the basis for the final path. Putting strange numbers in here will mean that you get a strange (and probably inefficient) path.
[bquote][A] Graphics Engine = 14 days
[array='B'] Sound Engine = 5 days
[C] Music Engine = 5 days
[D] Input Engine = 10 days
[E] Gameplay/general programming = 31 days
[F] Physics = 7 days
[G] 2D Artwork = 14 days
[H] 3D Artwork = 21 days
[array='I'] Sound effects = 14 days
[J] Music recording = 9 days
[K] Level Design = 21 days [/bquote]Chances are you will have a different prediction for all of the above, but bear with me - it's the process that counts here. Also note that the times above are for a single person doing the task, assuming that he/she works on the task for all of the hours they can (be it an 8 hour working day).
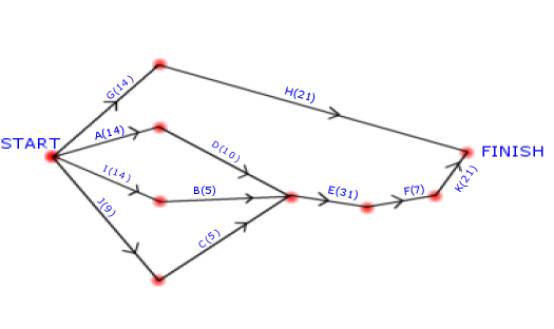
Now that you have some times you need to add them to your network. By convention they go in brackets after the activity label. The graph now looks like this:
[size="5"]
Critical Path Analysis: Step 5
Now you have analysed the project, worked out what activities are involved, decided what the dependency list is, and calculated some times for those activities - and it's all included in your graph. You can now start the algorithm.
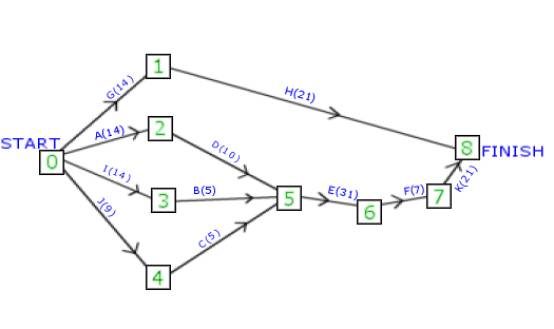
There is one final thing that you must do (to make it easier for you), which is to add in events. So far you've just added activities. Events are actually already in the graph - the red dots - but you need a way of identifying them. As you're already using letters for activities you'll use numbers for the events. Below is the revised graph:
Now, on with the algorithm. The first step is to work out what the earliest times are for each of the events (the numbered boxes). The value that you calculate will be the earliest possible time that you can arrive there with all incoming events completed. To work them out you scan forward through the network
adding the previous events' earliest time and the activity length together. If there are multiple activities coming into an event you must select the
largest one - this is simply because you cannot get to the event until ALL activities are complete, and you know all activities are complete when the one with the longest duration is complete.
While the above isn't too complicated, we'll work through the example graph to see how it all works. You're going to use a simple table to accumulate all the results:
EVENTS012345678Ei Starting at event 0: there are no incoming activities, and as it's the start you know the earliest time it can be reached is 0 (days).
EVENTS012345678Ei0 Moving to event 1 now, this only relies on activity G being completed, which has a duration of 14 days. Therefore the earliest time that you can get to Event 1 is 14 days.
EVENTS012345678Ei014 Event 2 only has activity A to depend on; therefore the earliest arrival time will be 14 days
EVENTS012345678Ei01414 Event 3 only depends on activity I being complete; earliest time is therefore 14 days
EVENTS012345678Ei0141414 Event 4 only depends on activity J, so the earliest time of arrival is 9.
EVENTS012345678Ei01414149 Event 5; has 3 incoming activities; the 3 possible earliest times are:
(2)->(5) = 14 + 10 = 24
(3)->(5) = 14 + 9 = 23
(4)->(5) = 9 + 5 = 14
You must choose the largest value (see the rules at the top), so the earliest time you can get to event 5 is 24 days
EVENTS012345678Ei0141414924 Event 6 only depends on activity E, so the earliest time of arrival is the earliest time of arrival at event 5 plus the duration of activity E, or 24 + 31 = 55.
EVENTS012345678Ei014141492455 Event 7 only depends on event 6 and activity F, so the earliest time is 55 + 7 = 62.
EVENTS012345678Ei01414149245562 Finally, Event 8. Event 8 depends on two activities:
(1)->(8) = 14 + 21 = 35
(7)->(8) = 62 + 21 = 83
You must choose the largest value, which in this case is 83.
EVENTS012345678Ei0141414924556283Hardly a complex task, but if you have a complicated network it can get a little tedious after a while! From the data that you've just calculated you can tell that the earliest time the whole project can be completed is 83 days. If nothing goes wrong then this is how long it will take.
You aren't finished yet though; you need to calculate another set of numbers (and then some more). The next set of numbers is the latest time - the latest time that you can arrive at the event and still complete the project on time. You'll see why this is important later on in the process.
To calculate the latest time of arrival you use a very similar method to the earliest time method. The only main difference is that you start from the end and go backwards, and in the case of multiple choices you choose the lowest value (instead of the largest value). Here goes then:
Event 8, as with the start node. The latest you can get here and still complete the project on time is the total project length - 83 days.
EVENTS012345678Ei0141414924556283Li 83Event 7 only has 1 activity coming out of it - K, so you take K away from 83 and you'll have the latest time of arrival: 83 - 21 = 62.
EVENTS012345678Ei0141414924556283Li 6283Event 6 only has activity F coming out of it, so the latest time of arrival is (7) - F(7) = 62 - 7 = 55.
EVENTS012345678Ei0141414924556283Li 556283If you're starting to notice a pattern here you're on the right track - I'll explain this pattern later.
Event 5 only has E(31) coming out of it, so the latest time of arrival is (6) - E(31) = 55 - 31 = 24.
EVENTS012345678Ei0141414924556283Li 24556283Now event 4, which only has activity C(5) coming out of it. The latest time of arrival is therefore (5) - C(5) = 24 - 5 = 19.
EVENTS012345678Ei0141414924556283Li 1924556283The pattern seems to have stopped - you may be thinking. But you don't know what the pattern means yet...
Event 3 only has B(5) coming out of it, the latest time of arrival is (5) - B(5) = 24 - 5 = 19.
EVENTS012345678Ei0141414924556283Li 191924556283Event 2 only has activity D(10) coming out of it, so the latest time of arrival is (5) - D(10) = 24 - 10 = 14.
EVENTS012345678Ei0141414924556283Li 14191924556283Event 1 only has activity H(21) coming out of it, so the latest time of arrival is (8) - H(21) = 83 - 21 = 62.
EVENTS012345678Ei0141414924556283Li 6214191924556283Finally, Event 0 has 4 activities coming out of it:
(0)->(1) via G(14) = (1) - G(14) = 62 - 14 = 48
(0)->(2) via A(14) = (2) - A(14) = 14 - 14 = 0
(0)->(3) via I(14) = (3) - I(14) = 19 - 14 = 5
(0)->(4) via J(9) = (4) - J(9) = 19 - 9 = 10
You have to pick the smallest value, which in this case is 0. So your final table looks like:
EVENTS012345678Ei0141414924556283Li06214191924556283
[size="5"]
Critical Path Analysis: Step 6
You now have a fair amount of data about your project, but I haven't really explained what it all means.
Earliest Time Of Arrival: This indicates that if you were very quick and worked hard, then this is the earliest time that you could get to that event.
Latest Time Of Arrival: This is more important as far as the analysis goes. The value you have for the event indicates the latest time of arrival while still completing the project on time. Take event (1) for example, you could get there by day 14, yet you could put it off until day 62. If you start it before day 14 any other dependencies won't be ready (therefore it's impossible). If we start after day 62 the project will be delayed; yet we can start on any day between 14 and 62 and not hold the project up at all.
Those people that are working quickly today will have realised what the pattern means - the pattern where the Earliest time and Latest time are the same. All it really indicates is that you must be at that event by that day or the project will be delayed. If you only get to event (5) on day 26 the whole project will be delayed by 2 days, meaning that you cannot complete it until day 85.
You have a further calculation for this called the float and the slack. Float is for activities and slack is for events.
Float = Dest_Max - Src_Min - Activity_Length
Slack = Latest_Time - Earliest_Time
If the alack and/or the float is equal to 0 it is a critical event/activity; a critical activity must be completed on time and in order to avoid delays to the project.
A slack at any event means that if a person has completed the activity(s) prior to the event (and is ready to go onto the next event) they can rest/pause for that much time. A slack of 0 would mean that they can't pause at all and must carry on, but a slack of 10 means that they could spend 10 days spinning around in their chair. Later on when we look at scheduling we'll examine the possibility that instead of letting him/her spin around in their chair we get them working on another activity.
The float is similar, but it indicates how much extra time you can take, if it's a 10 day task and has a float of 3 then you can take up to 13 days to complete the task without delaying the project. It therefore makes sense that critical activities have a float of 0, because that activity must be done in the specified time period (or the project is delayed).
EVENTS
01
234
5678Ei
014
14149
24556283Li
062
141919
24556283Slack
048
0510
0000The revised table now shows the slack for each event. You can straight away see that events 0, 2, 5, 6, 7, and 8 are all critical events, and are said to be
on the critical path. We can use this to find out what the critical activities are, those activities between 0-2, 2-5, 5-6, 6-7, 7-8. It's not always that simple, so we'll do it the proper way - work out the float for each activity:
A = 14 - 0 - 14 = 0
B = 24 - 14 - 5 = 5
C = 24 - 9 - 5 = 10
D = 24 - 14 - 10 = 0
E = 55 - 24 - 31 = 0
F = 62 - 55 - 7 = 0
G = 62 - 0 - 14 = 48
H = 83 - 14 - 21 = 48
I = 19 - 0 - 14 = 5
J = 19 - 0 - 9 = 10
K = 83 - 62 - 21 = 0
I've made all the critical activities bold, and you can see what sort of float the other activities have. Combining this information you can calculate the critical path from start to finish:
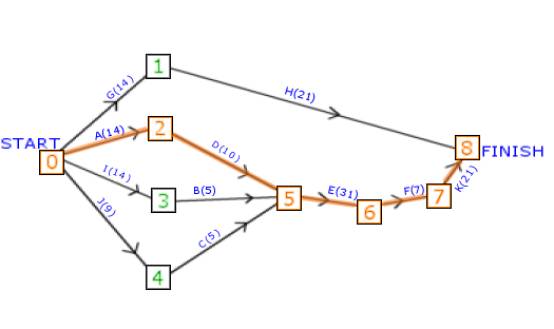
This critical path indicates that you must complete these tasks back-to-back with no delay:
[bquote]A - Graphics Engine
D - Input Engine
E - General Programming
F - Physics
K - Level Design[/bquote] Makes sense really, and it is quite likely that you would have come up with something similar without using the algorithm. But this is only a simple example.
However, that doesn't mean that you can skip the other activities. They're still just as important in the overall plan. The key point is that the critical activities and events must be reached by the designated time, or the project will be delayed.
[size="5"]
Critical Path Analysis: Step 7
You've now finished with the actual CPA algorithm, and now you're moving on to synthesizing the data you've gathered from using the algorithm. The most popular and easiest method of doing this is through scheduling, which is usually done by Gantt charts.
Designing Gantt charts and scheduling using them is done purely by eye - there is no magic algorithm to find the most optimal pattern. It does have it's weaknesses though; one particular example is specialist skills. The algorithm doesn't take into account any differences between the workers. For example, Bob can't do graphics engines, but can do general programming. You may well find that the optimal route only works properly in some cases - where there is always someone who can do the task at the given time; if there isn't then you have to wait until someone is available - and this could delay the project.
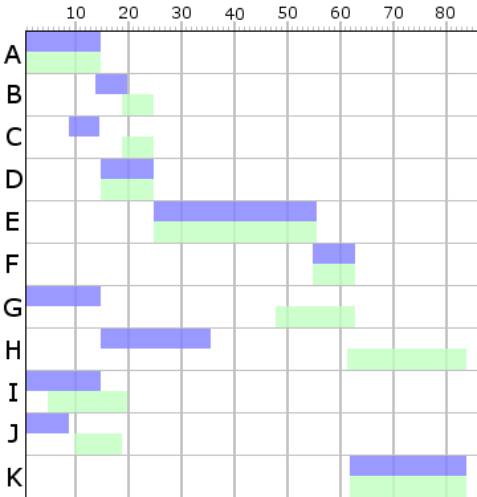
The first part of a Gantt chart is to plot all the activities in the correct positions. You'll use two rows for each activity - one being the earliest start/completion, and the second being the latest start/completion. The end result will look something like this:
- The earliest start of an activity is the earliest arrival time at the event before
- The earliest finish of an activity is the earliest start time + duration of the activity
- The latest start time of an activity is the latest arrival at the destination event - duration of the event
- The latest finish time of an activity is the latest start + duration of the activity
Therefore the completed table for the earliest start and earliest finishes is:
ActivityEarliest StartEarliest FinishLatest StartLatest FinishA014014B14191924C9141924D14241424E24552455F55625562G0144862H14356283I014519J091019K62836283
From this graph you can see the earliest and latest times that you can start activities. Each little block can be moved backwards and forwards as long as it's always after the earliest start time and before the latest start time. It is this fact that allows you to do the next part: scheduling.
Scheduling is where you shuffle all the little blocks around to form the most efficient way of completing the project. This is where it gets complicated. You must do it by eye, as mentioned: there is no algorithm to do it for you. There is often more than one possible arrangement, and you also have to take into consideration any skills based factors (can Bob actually do this task?). The first step is to redraw the Gantt chart so that you have people down the side (instead of activities). You can go about it two ways from here - either to use up all the available people, or try to arrange it so that you use as few people as possible (yet the few people you use are always busy). For this example we're going for the latter approach.
To get things started it's easiest to assign the first person to do all the critical activities. This person will then always have something to do, and it reduces the amount of juggling you have to do. The following diagram is one possible way of organising things:
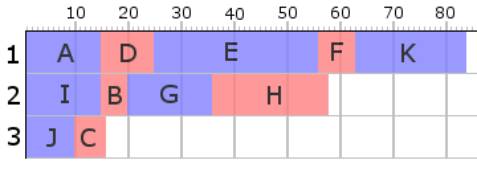
It's a bit annoying organising the I-B and J-C pairs; both have to be completed before E (on the critical path) can be started, yet you can't arrange them so that only one person does them. You could (in a real world situation) have persons 1 and 2 full time team members, and make person 3 a temporary person - once they've done tasks J & C they go away again...
[size="5"]
Conclusion
I hope this article has been of some use to you. As you've probably already noticed, this method has limited use for a one-person development team, and even with a multi-person team it still has its weaknesses. But ignoring those you can still get some very useful data from spending half an hour with this algorithm.
Feel free to email me with any questions, comments or otherwise: [email="MAILTO:JOLLYJEFFERS@GREENONIONS.NETSCAPEONLINE.CO.UK"]jollyjeffers@Greenonions.netscapeonline.co.uk[/email], or visit my site:
www.vbexplorer.com/directx4vb/ for more tutorials and theory pieces...
