We have all heard of linear and non-linear storylines. Linear stories aren't necessarily an indication of a boring story, but a non-linear story can definitely make a boring story interesting, if you put in a bit of effort. This article will use simplified fabula and syuzhet graphs to analyse existing stories. Then we will go on to create our own stories simply by looking at these graphs.
Some disclaimers: This article will not contain spoilers for anything. The concepts in this article can be applied to any story-writing medium. Also, this is not so much intended to teach a concept more than it is to inspire new and crazy ideas. Take your time with it!
Analysis
The concept is quite simple if you've ever touched a graph before; it's a 2-dimensional graph with the horizontal axis being "real-world" time and the vertical axis being "story" time. For example, a film may be 2 hours long (this is real-world time) but the film may be based on a story that goes over a period of 5 years (this is story time).
The best way to explain it is with some examples:
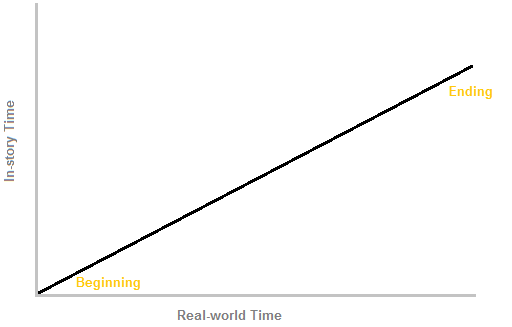
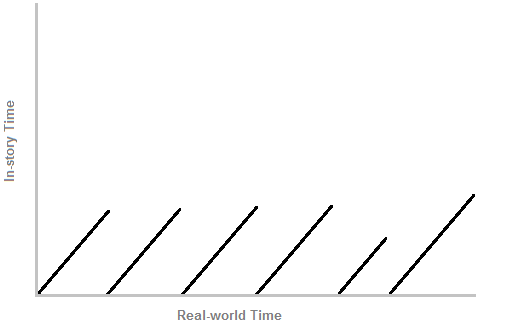
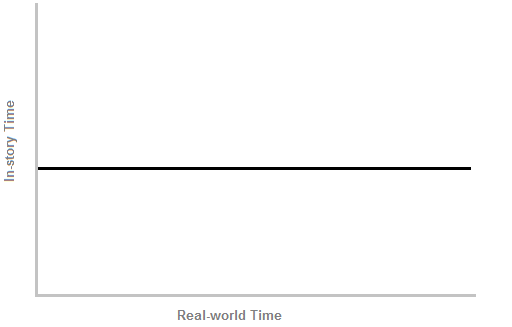
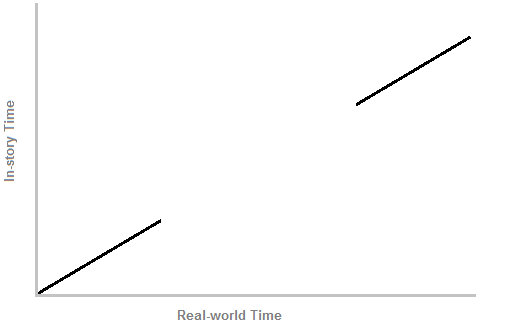
This first example shows most of the stories ever created in history; the linear plot. As you can see, the story begins at a particular point and steadily reaches the final point at the end of the plot. Pretty simple. Now, let's think about a more non-linear story. An example is James Cameron's Titanic. The film starts off with old-lady Rose telling the story to the scientists. The film then goes back in time to the point where she is telling the story. Periodically, the film cuts back to the present, meaning that there are, in fact, two stories running concurrently. So a simplified way to draw this would be:
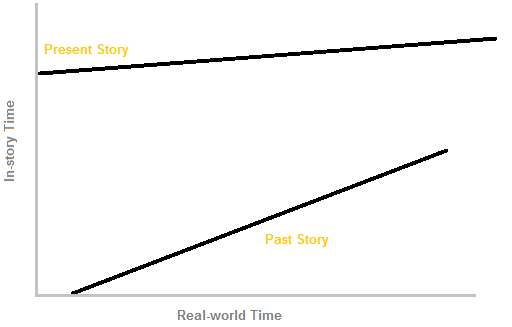
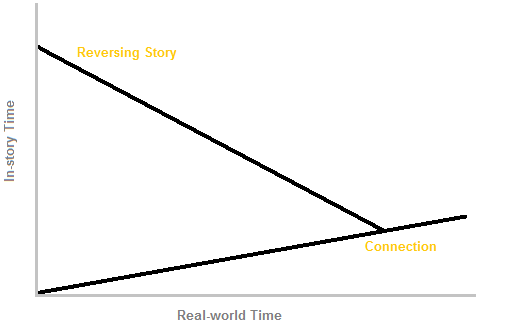
Although there are 2 stories going throughout the film, they are not touching and are considered to be at two different times. This is quite a common non-linear plot. A similar example to Titanic is Final Fantasy X. The game starts off with Tidus at the campfire, telling the story, then the story cuts back to the past to retell the events. This sounds almost identical to Titanic, but the difference is that Final Fantasy X's stories connect with each other. Later in the game, Tidus' story catches up to the present. At this point, Tidus stops telling the story and we see what he does after this connection.
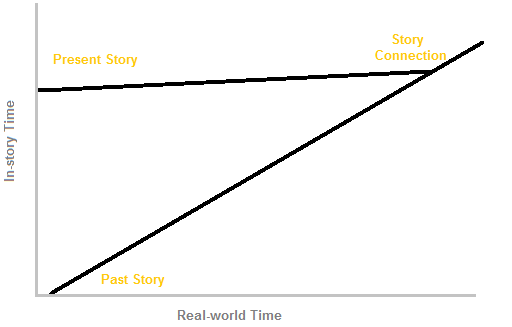
You can see from the graph that the stories connect and join into a single story. This is another common non-linear story. So what are some uncommon examples? Vantage Point had an interesting plot where it retold the same story from the perspective of different characters. This makes for a much more interesting graph:
You can see there are 8 perspectives shown, each one starting at a similar time but often ending at different points. Just by looking at the graph, you can see a lot about the overall plot. Alright, now for a more wacky example. Memento is a film about a guy with a memory problem where his short-term memory only lasts for a few minutes, and then he forgets everything he has just done. To simulate the memory difficulties that the character is having, the story has been told in an extremely disjointed way. One part is moving forward in a normal linear way. Another part (set in the future) is moving backwards in parts. Both of these parts alternate throughout the film and, at the end, these two parts join up. Wikipedia has a great graph here (may contain spoilers). A more simplified and spoiler-free graph could be this:
The complex plot of Memento can be explained with 2 lines.
Exercises
So we've analysed some different plots now and found some graphs to explain their plots. So now for the interesting part: we are going to create some graphs and see what stories we can come up with to explain the graph. I will go through two, just to get the ball rolling.
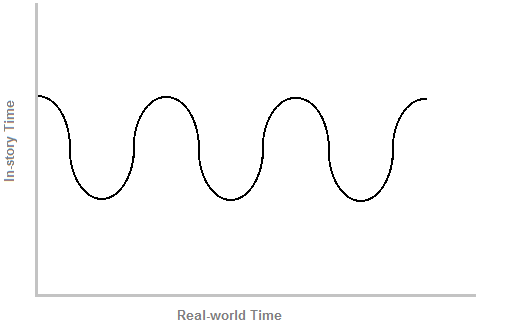
A simple squiggle. This alternates between going forwards and backwards in time. You can also see that the perspective of time speeds up and slows down (because the line is curved). So what sort of story could this tell? Maybe a character is redoing a task, but keeps on making mistakes. When the character makes the mistakes, he/she rewinds time, sees the mistake they made, and then tries to do it again, correcting the mistake. This is almost like the Vantage Point and Source Code films.
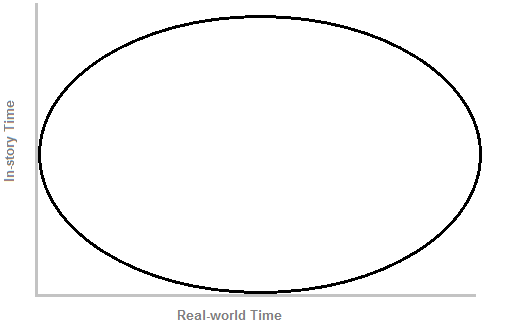
A simple circular shape. Because there are two lines (the upper half and the bottom half) this indicates that there are 2 stories going concurrently. Both are always going at the same changing speed, but in opposite directions. At the end, they meet up. To explain this, we might say that scientists test a time machine but get shot off in different directions in time. They then work to join back up in the present. Remember that just because the line is curved, doesn't mean that it has to be this timing exactly. In the memento example, one part was reversing. In the film, it was actually chopped up into many pieces, and each piece was shown in a forward matter. But the pieces were shown in reverse. I will not give explanations for the following graphs simply because there is no right or wrong answer. These are provided to make you think outside the box. Take your time with them.
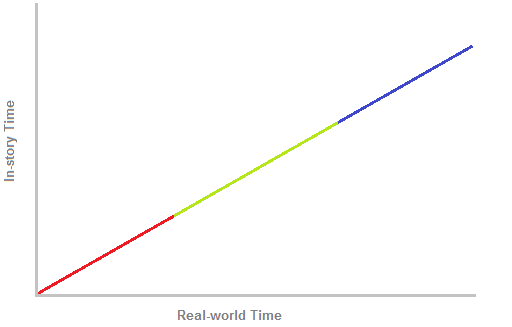
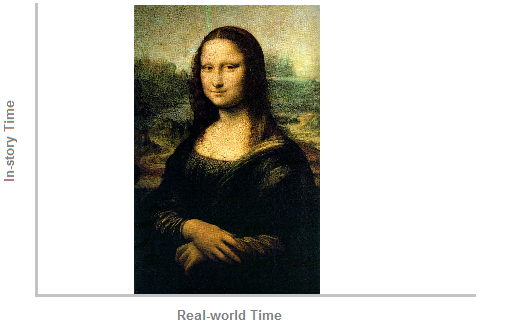
How about we spice things up with some new elements to play with. What happens if we add color? What do different colors represent?
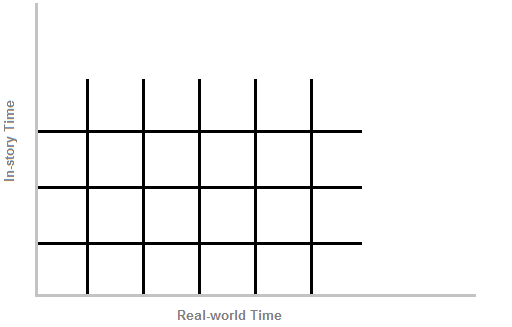
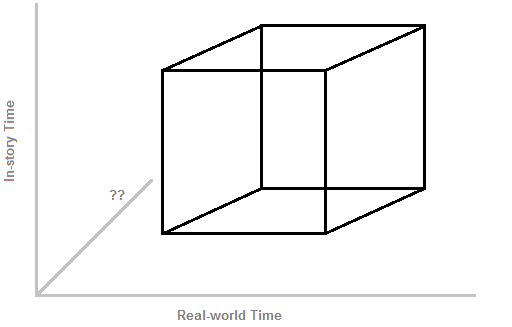
What about 3D? The third dimension might be used to explain something specific to the story.
Final Note
So, if you've got writers block or you're just bored, scribble some lines on a bit of paper and make a story using what you have drawn. Also, if you know any more examples of games/books/films/etc that have more wacky non-linear plots, feel free to post them below!


Another one: "Run Lola Run" (three possible ways a story could have gone, plus some flash-forward sequences showing you what happens to multiple side characters).
Most video games already have the graph of "Groundhog day" in some sense: Play the same story over and over again until you get all your actions right.