Introduction
Everyone looks for quick answers. It's human nature. Here on gamedev, programmers all-too-often attempt to fix problems they encounter with their applications by posting several (or even 100s of) lines of code, and simply state: "Here's some code. It doesn't work. What's wrong?" The apparent hope of the OP ( Original Post[er] ) is that someone else will spot a typo, coding or logic error, and post information that will send the OP happily on his/her way.
If the OP is very lucky, someone will spot the problem quickly and provide the hoped-for solution. More often than not, however, the OP's expectations are unfounded, and the topic discussion will carry on for a day or more. More often than not, though the OP is willing to find and correct problems, the OP doesn't know how to begin to find the problem.
Asking someone to find the problem for them seems like the only option. The premise of this article is that there are techniques for debugging programs that will find the source of an error more quickly than posting the question "What's wrong?" and getting a response that resolves the problem. Further, learning to debug will have cumulative benefits.
Not only will errors be found more quickly by the repeated practice of debugging, fewer problems will be encountered in future as the programmer finds and corrects errors, learning from his/her own mistakes. Another assumption is that the programmer is willing to approach debugging with discipline - i.e., is willing to determine, rather than guess, what portion of the code is most likely the source of the problem.
Aye, there's the rub. How does one do that? This article describes an approach to debugging that will often result in a programmer finding the problem in minutes, rather than days.
Other Debugging Techniques
Before a programmer dives into "Follow The Data" debugging, several alternative approaches may be useful, particularly in locating a good starting point for the investigation. A common starting point used by many programmers to determine where a problem occurs is to comment out a few lines of code, in order to eliminate sections of code which may or may not be causing the problem.
In the long view of things, that's just hacking, as "good programming practice" dictates that small sections of code are tested during project development, and should be known to be "correct." However, being realistic, quite often, that boat has sailed. Everyone cuts-and-pastes code, or codes several interdependent routines at once.
Furthermore, problems may occur when "good" routines interact only intermittently, or only under specific conditions during execution. As a result, commenting out sections of code, if the flow of the program allows it, may point to a section of code causing the problem. If so, knowing what section(s) of code needs further examination or debugging is a valuable clue.
However, modifying code to determine where a problem occurs may itself result in further complications if results are misinterpreted, or the editing is not properly undone. Less intrusive than modifying existing code, and a more obvious way to examine data values, just displaying values while the program is running will often provide sufficient information to determine the section of code in which an error occurs.
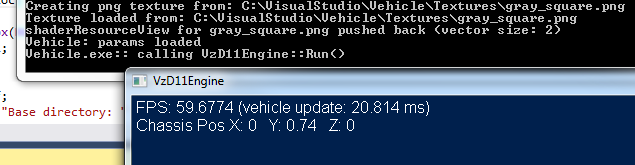
If your application and/or API permit, values can be displayed by the program itself, or by dumping information to an accompanying console window. The user must be familiar with text output techniques such as OutputDebugString (Visual Studio), std::cout, printf(...), etc. Particularly for graphics programs, an accompanying console window can be an invaluable debugging tool.
That approach will frequently enough result in the discovery, for instance: "I didn't consider negative numbers!" or similar oversights. However, that approach assumes the programmer already knows what values may be pertinent to the problem at hand.
In some cases, providing information on-screen can be quite useful. The programmer may want to use visual tools to aid in the debugging process. As mentioned in that article, such tools should be a complement to other debugging methods. If additional information is needed to determine the problem, the programmer can prepare to "follow the data" by considering -
"Follow The Data" - An Approach to Debugging
This approach assumes that a program compiles and links without error, but, when executed, does not provide the "results" the programmer desires. This approach can be used for determining, at a minimum, a section of code in which the problem is occurring, by following the data. With a little persistence, the problem can be found within a few lines of code, or even within a single line of code. The intent is to aid posters to anticipate the inevitable question: What have you tried?
The Concept
The concept of Following The Data is: The programmer examines actual runtime variable values to determine where "good" data turns to "bad" data. If a section of code has good values flowing into it, but the results flowing out of the section are not what is expected or desired, the process is refined to examine values in smaller and smaller sections of code, eventually locating, if not a single line of code, a reasonbly few lines of code that have correct values being used in calculations or function calls, but the results following execution of that code is not as expected.
The programmer can then check the syntax of the code, whether the appropriate function is being called, etc.; the programmer corrects the code; and the application is re-run to determine if the corrections just made solved the original problem.
Prerequisites for Following The Data
1. Know the Approach is Valid. Computers are stupid. Feed good data to bad code and you'll get bad results. A program must be comprised of good code being fed good data. In the context of this article, "good code" implies that the programmer takes responsibility to not only write code that implements an algorithm correctly, but takes responsibility to ensure that the algorithm itself is the appropriate method to achieve the desired results.
The benefit of understanding what code should do, and how that code should do it, will result in more quickly identifying sources of error. In addition, if a problem still cannot be located, the programmer will be better able to ask questions that will lead more quickly to the right answer.
For example, a post asking "How do positions get converted to depth values?" will assuredly get better results than "My depth values are wrong. What's wrong with my code?" As an aside, familiarity with the what and how of a process will make future changes, enhancements and refactoring of the code much easier.
2. Know what Good Data looks like. The importance of being able to say: "I've verified the input to this section of code is what I expect." cannot be over-emphasized. It's not sufficient that data looks "about right." Computers do only what they're programmed to do, with the data fed into them. It's a case of GIGO: Garbage In, Garbage Out.
For code to produce the desired results, the data must be more than "about right." It must be correct. As implied in section The Concept above, the programmer must know what "good" data looks like. I.e., when a value is examined, the programmer must make a determination whether the problem has been found, or the debugging process needs to be continued.
Sometimes it's sufficient to be able to recognize "bad" data or values, but knowing "good from bad" is better. To distinguish good values from bad, the programmer should be familiar not only with what the code should do, but how the code should do it. That's commonly easier said than done, and may require research, self-education or formal education to gain that knowledge. That's the importance of Prerequisite No. 1 above.
3. Use an appropriate programming interface ( an IDE ) To follow the data, the programmer will need an IDE that supports setting breakpoints, and examining or displaying individual variable values while the suspect program is running. If a programmer does not have those capabilities at hand, the "follow-the-data" approach is all but impossible.
If you aren't using an interface that provides those means: get one. The following illustrates the benefits of an IDE as described above. As an example, a program returns an error (or "crashes") when trying to open a file. The progam code makes a call to determine the path to be used; the name of the file to be opened is appended to the path; and a function is called to open the file given a string comprised of the path + filename.
The programmer knows that the correct path to the file must be provided to the function which opens the file. One of the first things that must be checked then: is the path correct? The programmer sets a breakpoint at the code which determines the path to be used, and examines the path.
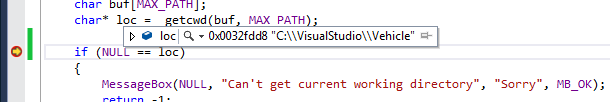
The programmer mouses over the variable loc to determine if it is what was assumed when the code was written. If the programmer understands how the code should work, and what "good" input data looks like, he/she may immediately recognize: "The path doesn't end with slashes!" That is, merely appending the filename to the variable loc would result in "C:\\VisualStudio\\vehiclemyFile.txt", rather than "C:\\VisualStudio\\vehicle\\myFile.txt"
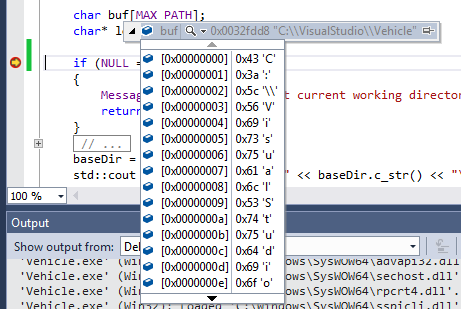
The problem has been located and can be corrected. Time expended: a few minutes. Just for the purposes of illustration of the benefit of a good debugging IDE, more detailed data can be examined by (in this example) clicking on the triangular "drop-down" symbol by the variable name in the value popup. Shown below, the contents of the array buf can be examined, character-by-character.
Follow The Data
Even with the knowledge of what the code should do, how the code should do it, and the tools to determine if the code, in fact, does what it should, it's not always easy to determine where to start. Unfortunately, there are more types of problem indications than can be addressed in a generic way.
As mentioned above, if the programmer can determine a section of code which causes the problem, perhaps by commenting out lines or sections of code, that can provide a starting point. Lacking that information, the programmer can start at the beginning - start at the program's entry point.
Step 1: Set a breakpoint and examine values. Start by setting a breakpoint at a point in the code where values can be examined and determined to be good or bad. That breakpoint may have to be in, for example, in the program's main() procedure. As experience in programming and debugging is gained, choosing an appropriate location for a breakpoint closer to the source of the problem will get easier.
Examining values should be approached with rigor. That is, each value that has any possibility of affecting the results must be looked at. Certainly, examining the most obvious* values within a section of code can be done first. However, if no incorrect values are found among those examined, either examine them all, or make a note that there still may be a problem in that section of code.
* What is an "obvious" value comes with the understanding of what the code is supposed to do, and how it should do it. If the values at that point in the program are correct, continue with this same step. I.e., set a breakpoint further along in the code.
Step 2: One or more incorrect values have been found. Determine why the value(s) are incorrect. That may be easier said than done. However, as mentioned above, the programmer now has to look at both what the code is supposed to do, and how the code does it. Being realistic, some "what's" and "how's" may not be well understood by the programmer.
This may be an occasion to post a question here on GameDev.net. That post can now be of the form:
"I want the following 4 lines of code to [description of do WHAT]. I have verified that the input values up to this point are correct, but the value of [a variable that's been examined] is incorrect. Can someone help me determine whether the code is correct for what it's supposed to do? Is there a better way to do that?" That will likely get better responses than "Here's 20 lines of code. It doesn't seem to work right. What's wrong?"
It is often the case that it is faster, and likely a better learning opportunity, to review (for example) the documentation for each function call, to determine if what the code should do, and how it does it, are appropriate.
Example of Following the Data
Shader Input Problem - A Subtle Error
The display of a skinned mesh didn't "look right." A decision was made to determine if the shader itself, or the data being fed to the shader, was at fault. Using a shader debugger, it was determined by examining input values to the vertex portion of the shader, that the values were incorrect. That didn't mean the shader was correctly coded, but, at a minimum, one or more problems existed before the shader was called.
Considering the possibility that the data may not be correct from the very start, a breakpoint was set in the routine that loaded the vertex data from a file and created the vertex buffer from that input data. The data used to fill the vertex buffer was examined and, to the best of the programmer's knowledge, appeared to be correct. The vertex buffer was created without error.
It also appeared that the indices and index buffer was created correctly. As the next use of that data was rendering it, a breakpoint was set at the beginning of the routine for rendering skinned meshes. The code leading up to the draw call which used that shader was comprised of a dozen or more steps, such as binding the vertex and index buffers, setting the stride and offset for the vertex buffer, binding constant buffers and textures, etc.
"Obvious" variables were examined first. E.g., the pointers to the vertex and index buffers were not NULL, nor were the pointers to the buffers and textures. A more rigorous check of the value of each variable in each call in that section of code was made. It was determined that the stride for the vertex buffer was based on a vertex structure for a static mesh (unskinned), rather than the vertex structure for a skinned mesh.
That is, the static mesh vertex did not include blend indices or blend weights, though the rest of structure was identical to the structure for the skinned mesh. The error was caused by using sizeof(StaticMeshVertex) for the stride, rather than sizeof(SkinnedMeshVertex). The error was made even more subtle because the vertex stride was stored in the mesh structure itself, and was accessed with mesh->stride.
Conclusion
Learning how to debug efficiently will save the programmer time. "Following the Data" is one technique that, if practiced and applied conscientiously, will do just that.
Article Update Log
15 Feb 2015 - Draft completed.
16 Feb 2015 - Approved for peer review.


I had a bug recently which was very tough to isolate and figure out, and no existing debugging technique I had could find it. I'm using the Unreal Engine code to build a game, and a part of the build process involves a reflection processing step which parses the code base and builds some generated C++ code. The code generator doesn't care about folder and file structure, it'll go through each directory and subdirectory and add every source file it finds to the build process (even if its not in your project).
So, what was happening? If I added in another source file (.h & .cpp), the program would fail to compile and a few other classes would suddenly get hundreds of linker errors. If I deleted these new files, those linker errors would go away. It didn't matter what the source files contained, just that they existed. Not one error in my IDE indicated what the true cause of the problem was. How do you debug problems like that?
I took a scientific approach.
The problem was repeatable and conditional upon something. I didn't know what the condition was. So I started coming up with hypotheses and rigorously testing each one. Each time a hypothesis was invalidated, I'd come up with a new one and test it. Through the process of testing my hypotheses, I stumbled on something. "Hmm, that's weird. I have a duplicate header file in this subfolder. I'll make another hypothesis about this and test it." It turns out, that was the underlying cause of the error. I'm guessing the build tool has some sort of internal threshold it uses to split build tasks into separate threads, and when I added a 30th source file, I'd cause it to split the build into two threads and one of them was using my duplicate header file which was out of date. It took me two days to find this error.
So, in conclusion I think taking a rigorous scientific approach to debugging is the most effective way to debug. Your "follow the data" approach is a subset of this (testing expected results vs. generated results).