In this article, I'd like to share a method I used to help visually debug tree-like data structures by leveraging the DOT format and Graphviz. This may be useful to you if you ever end up having to work with low-level data structures and no way to visually see what your code is doing.
The Problem
During the early stages of development of my inverse kinematics library (which, at the time of writing, is in its alpha stages and not quite ready for general use yet), I was working on an algorithm which takes a scene graph as its input and generates an optimised structure consisting of a tree of "chains", specifically designed for use with an IK solver.
The transformation is not that easy to explain in words, but here is an illustration of before (a) and after (b) (please excuse my MSPaint skills; I'm a programmer, not an artist):
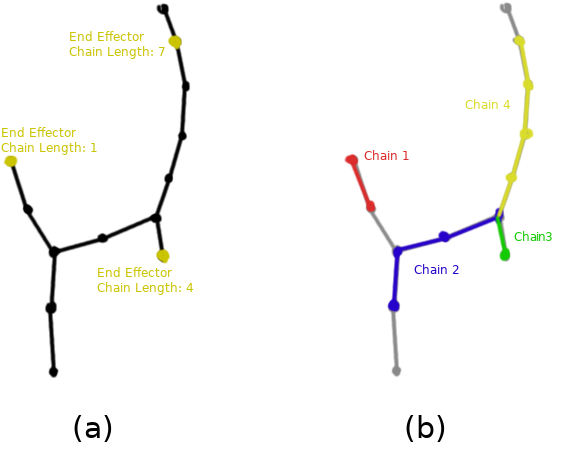
You can see here that each end effector in the scene graph specifies a "chain length" parameter, which tells the solver how many parent nodes are affected. Since the IK solver works most efficiently on single chains of nodes, it makes sense to break down the scene graph into multiple chains which the solver can then process sequentially. This is illustrated in (b). Notice how chain 1 (red) becomes isolated from the rest of the tree after processing, because its end effector only specified a length of 1. Also notice how in the new structure each chain consists of only a sequence of nodes with no branches.
The algorithm had to be able to handle a few weird edge cases, such as:
- What happens when you place an effector on a node that has multiple children?
- What happens when there are multiple end effectors in a chain?
- What happens when an end effector specifies a chain length that doesn't quite join up with the rest of the tree?
This of course meant it was harder to test and make sure it was working correctly. I did of course write a suite of unit tests using Google's testing framework, but I wanted more: I wanted to have the ability to visually look at what my algorithm was generating, and I wanted to do this without having to use some fancy 3D engine.
Inroducing: DOT and Graphviz
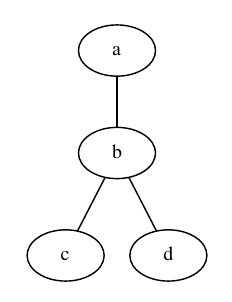
DOT is a simple graph description language. Graphviz is a set of open source tools for generating graphics from DOT descriptions. For example, the following DOT code:
graph testgraph {
    a -- b;
    b -- c;
    b -- d;
}
Compiled with dot as follows:
dot -Tpdf testgraph.dot -o testgraph.pdfProduces the following graphic:
DOT is quite a powerful language. It's possible to specify colours, shapes, multiple connections between nodes, and much more! Read up on the format specification for more information.
In only a few lines of code I was able to iterate the optimised chain tree and serialise it to DOT. This is what the example tree I drew in MSPaint looks like after it is broken down by my algorithm and exported to DOT:
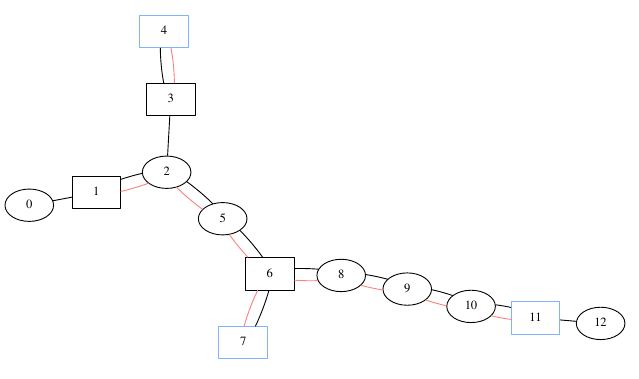
Things to note:
- The black edges show the connections between the original tree.
- The red edges show how the chains are connected (just like in the first figure (b))
- Effector nodes are coloured blue
- Nodes that mark the start or end of a chain are square. You can see for example that node 6 is square because it has two child chains, but node 2 is not square because it's in the middle of the second chain.
And just like that I had a powerful way to quickly spot errors in my algorithm. Using python and watchdog I wrote a simple script that would monitor the DOT file for changes and automatically compile it to PDF. Thus, every time I ran my program the graphic would update immediately on my second monitor so I could inspect it.
Another Example
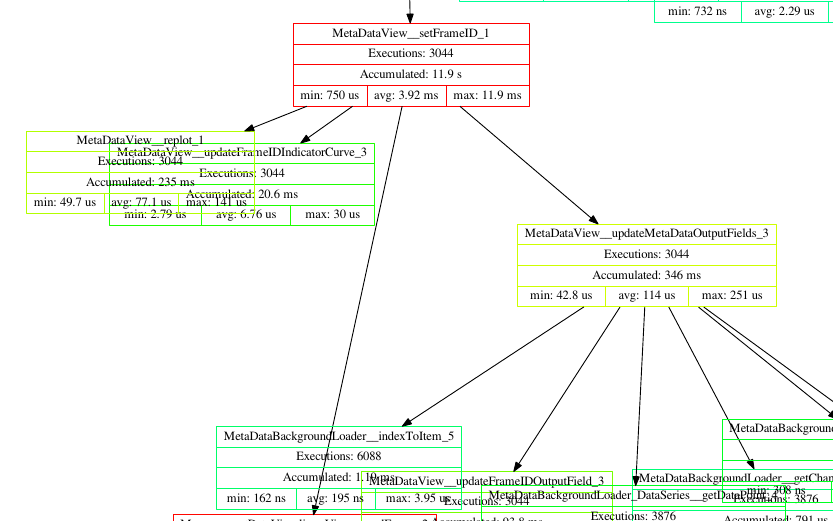
In another application I wrote, I implemented an intrusive profiler which would dynamically build a tree from the callgraph and store timing information in each node. I thought it would be cool to also dump this tree to DOT format and see what it looked like. Note that in this case I didn't use the "dot" command line tool, instead I used "neato" (this is also part of the Graphviz package). Neato has a different layout algorithm based on physical constraints, which in this case produces much nicer graphs than "dot":
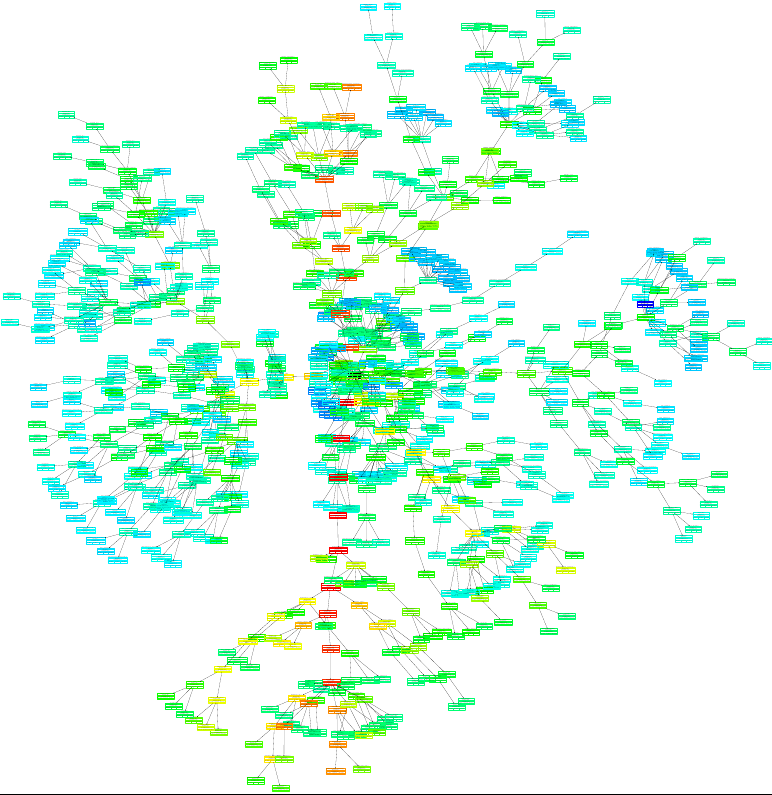
I find it quite beautiful to look at. What you see here is a visual representation of how much time was spent where in the program. Nodes that are red are "hot" (meaning lots of time was spent in them) and nodes that are blue are "cold" (nearly no time was spent in them).
If you zoom in a little bit you can also see that I exported some of the profiler parameters of each function.
While this does provide a very nice birds eye view of where your program needs optimising, I would of course recommend using proper profiling tools to further analyse the slow functions.
In conclusion
Due to the simplicity of the DOT language, it's trivial to write an exporter for it, so if you ever find yourself fiddling with low level data structures, consider dumping them to DOT and visualising them. I found this to be extremely helpful during development of my IK library.

Hey, I've looked into your ik library and it seems awesome. How stable it is, besides alpha, is it ready to use? And do you anticipate if the API is going to have significant changes in the future?