Performance is everybody's responsibility, no matter what your role. When it comes to the GPU, 3D programmers have a lot of control over performance; we can optimize shaders, trade image quality for performance, use smarter rendering techniques... we have plenty of tricks up our sleeves. But there's one thing we don't have direct control over, and that's the game's art. We rely on artists to produce assets that not only look good but are also efficient to render. For artists, a little knowledge of what goes on under the hood can make a big impact on a game's framerate. If you're an artist and want to understand why things like draw calls, LODs, and mipmaps are important for performance, read on! To appreciate the impact that your art has on the game's performance, you need to know how a mesh makes its way from your modelling package onto the screen in the game. That means having an understanding of the GPU - the chip that powers your graphics card and makes real-time 3D rendering possible in the first place. Armed with that knowledge, we'll look at some common art-related performance issues, why they're a problem, and what you can do about it. Things are quickly going to get pretty technical, but if anything is unclear I'll be more than happy to answer questions in the comments section. Before we start, I should point out that I am going to deliberately simplify a lot of things for the sake of brevity and clarity. In many cases I'm generalizing, describing only the typical case, or just straight up leaving things out. In particular, for the sake of simplicity the idealized version of the GPU I describe below more closely matches that of the previous (DX9-era) generation. However when it comes to performance, all of the considerations below still apply to the latest PC & console hardware (although not necessarily all mobile GPUs). Once you understand everything described here, it will be much easier to get to grips with the variations and complexities you'll encounter later, if and when you start to dig deeper.
Part 1: The rendering pipeline from 10,000 feet
For a mesh to be displayed on the screen, it must pass through the GPU to be processed and rendered. Conceptually, this path is very simple: the mesh is loaded, vertices are grouped together as triangles, the triangles are converted into pixels, each pixel is given a colour, and that's the final image. Let's look a little closer at what happens at each stage. After you export a mesh from your DCC tool of choice (Digital Content Creation - Maya, Max, etc.), the geometry is typically loaded into the game engine in two pieces; a Vertex Buffer (VB) that contains a list of the mesh's vertices and their associated properties (position, UV coordinates, normal, color etc.), and an Index Buffer (IB) that lists which vertices in the VB are connected to form triangles. Along with these geometry buffers, the mesh will also have been assigned a material to determine what it looks like and how it behaves under different lighting conditions. To the GPU this material takes the form of custom-written shaders - programs that determine how the vertices are processed, and what colour the resulting pixels will be. When choosing the material for the mesh, you will have set various material parameters (eg. setting a base color value or picking a texture for various maps like albedo, roughness, normal etc.) - these are passed to the shader programs as inputs. The mesh and material data get processed by various stages of the GPU pipeline in order to produce pixels in the final render target (an image to which the GPU writes). That render target can then be used as a texture in subsequent shader programs and/or displayed on screen as the final image for the frame. For the purposes of this article, here are the important parts of the GPU pipeline from top to bottom: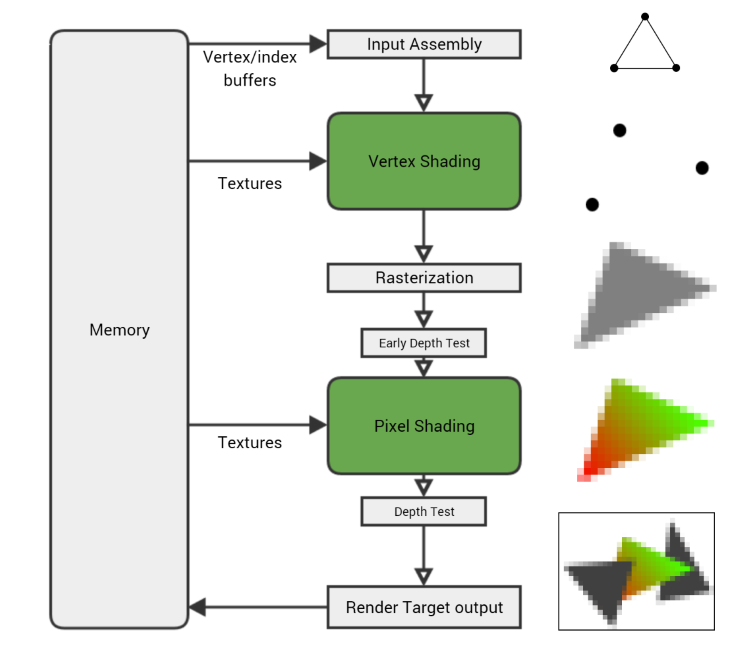
- Input Assembly. The GPU reads the vertex and index buffers from memory, determines how the vertices are connected to form triangles, and feeds the rest of the pipeline.
- Vertex Shading. The vertex shader gets executed once for every vertex in the mesh, running on a single vertex at a time. Its main purpose is to transform the vertex, taking its position and using the current camera and viewport settings to calculate where it will end up on the screen.
- Rasterization. Once the vertex shader has been run on each vertex of a triangle and the GPU knows where it will appear on screen, the triangle is rasterized - converted into a collection of individual pixels. Per-vertex values - UV coordinates, vertex color, normal, etc. - are interpolated across the triangle's pixels. So if one vertex of a triangle has a black vertex color and another has white, a pixel rasterized in the middle of the two will get the interpolated vertex color grey.
- Pixel Shading. Each rasterized pixel is then run through the pixel shader (although technically at this stage it's not yet a pixel but 'fragment', which is why you'll see the pixel shader sometimes called a fragment shader). This gives the pixel a color by combining material properties, textures, lights, and other parameters in the programmed way to get a particular look. Since there are so many pixels (a 1080p render target has over two million) and each one needs to be shaded at least once, the pixel shader is usually where the GPU spends a lot of its time.
- Render Target Output. Finally the pixel is written to the render target - but not before undergoing some tests to make sure it's valid. For example in normal rendering you want closer objects to appear in front of farther objects; the depth test can reject pixels that are further away than the pixel already in the render target. But if the pixel passes all the tests (depth, alpha, stencil etc.), it gets written to the render target in memory.
float3    MaterialColor;
Texture2D MaterialTexture;
SamplerState TexSampler;

float3 LightDirection;
float3 LightColor;

float4 MyPixelShader( float2 vUV : TEXCOORD0, float3 vNorm : NORMAL0 ) : SV_Target
{
    float3 vertexNormal = normalize(vNorm);
    float3 lighting = LightColor * dot( vertexNormal, LightDirection );
    float3 material = MaterialColor * MaterialTexture.Sample( TexSampler, vUV ).rgb;

    float3 color = material * lighting;
    float alpha = 1;

    return float4(color, alpha);
}
A simple pixel shader that does basic lighting. The inputs at the top like MaterialTexture and LightColor are filled in by the CPU, while vUV and vNorm are both vertex properties that were interpolated across the triangle during rasterization.
And the generated shader instructions:
dp3 r0.x, v1.xyzx, v1.xyzx
 rsq r0.x, r0.x
 mul r0.xyz, r0.xxxx, v1.xyzx
 dp3 r0.x, r0.xyzx, cb0[1].xyzx
 mul r0.xyz, r0.xxxx, cb0[2].xyzx
 sample_indexable(texture2d)(float,float,float,float) r1.xyz, v0.xyxx, t0.xyzw, s0
 mul r1.xyz, r1.xyzx, cb0[0].xyzx
 mul o0.xyz, r0.xyzx, r1.xyzx
 mov o0.w, l(1.000000)
 ret
The shader compiler takes the above program and generates these instructions which are run on the GPU; a longer program produces more instructions which means more work for the GPU to do.
As an aside, you might notice how isolated the shader steps are - each shader works on a single vertex or pixel without needing to know anything about the surrounding vertices/pixels. This is intentional and allows the GPU to process huge numbers of independent vertices and pixels in parallel, which is part of what makes GPUs so fast at doing graphics work compared to CPUs.
We'll return to the pipeline shortly to see where things might slow down, but first we need to back up a bit and look at how the mesh and material got to the GPU in the first place. This is also where we meet our first performance hurdle - the draw call.
The CPU and Draw Calls
The GPU cannot work alone; it relies on the game code running on the machine's main processor - the CPU - to tell it what to render and how. The CPU and GPU are (usually) separate chips, running independently and in parallel. To hit our target frame rate - most commonly 30 frames per second - both the CPU and GPU have to do all the work to produce a single frame within the time allowed (at 30fps that's just 33 milliseconds per frame).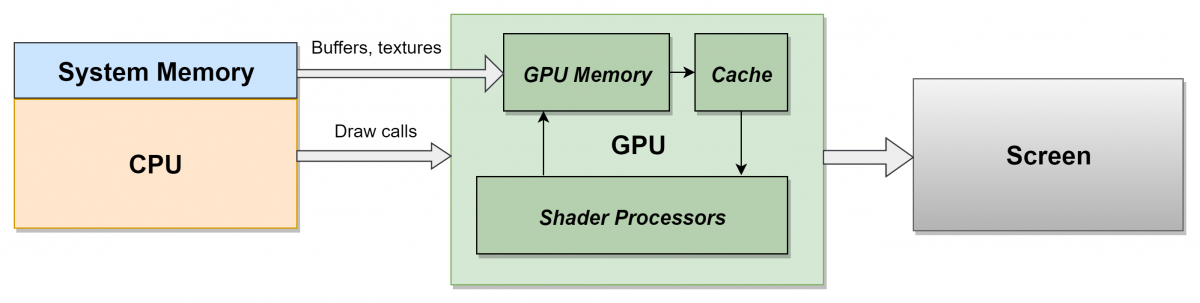 To achieve this, frames are often pipelined; the CPU will take the whole frame to do its work (process AI, physics, input, animation etc.) and then send instructions to the GPU at the end of the frame so it can get to work on the next frame. This gives each processor a full 33ms to do its work at the expense of introducing a frame's worth of latency (delay). This may be an issue for extremely time-sensitive twitchy games like first person shooters - the Call of Duty series for example runs at 60fps to reduce the latency between player input and rendering - but in general the extra frame is not noticeable to the player.
Every 33ms the final render target is copied and displayed on the screen at VSync - the interval during which the monitor looks for a new frame to display. But if the GPU takes longer than 33ms to finish rendering the frame, it will miss this window of opportunity and the monitor won't have any new frame to display. That results in either screen tearing or stuttering and an uneven framerate that we really want to avoid. We also get the same result if the CPU takes too long - it has a knock-on effect since the GPU doesn't get commands quickly enough to do its job in the time allowed. In short, a solid framerate relies on both the CPU and GPU performing well.
To achieve this, frames are often pipelined; the CPU will take the whole frame to do its work (process AI, physics, input, animation etc.) and then send instructions to the GPU at the end of the frame so it can get to work on the next frame. This gives each processor a full 33ms to do its work at the expense of introducing a frame's worth of latency (delay). This may be an issue for extremely time-sensitive twitchy games like first person shooters - the Call of Duty series for example runs at 60fps to reduce the latency between player input and rendering - but in general the extra frame is not noticeable to the player.
Every 33ms the final render target is copied and displayed on the screen at VSync - the interval during which the monitor looks for a new frame to display. But if the GPU takes longer than 33ms to finish rendering the frame, it will miss this window of opportunity and the monitor won't have any new frame to display. That results in either screen tearing or stuttering and an uneven framerate that we really want to avoid. We also get the same result if the CPU takes too long - it has a knock-on effect since the GPU doesn't get commands quickly enough to do its job in the time allowed. In short, a solid framerate relies on both the CPU and GPU performing well.
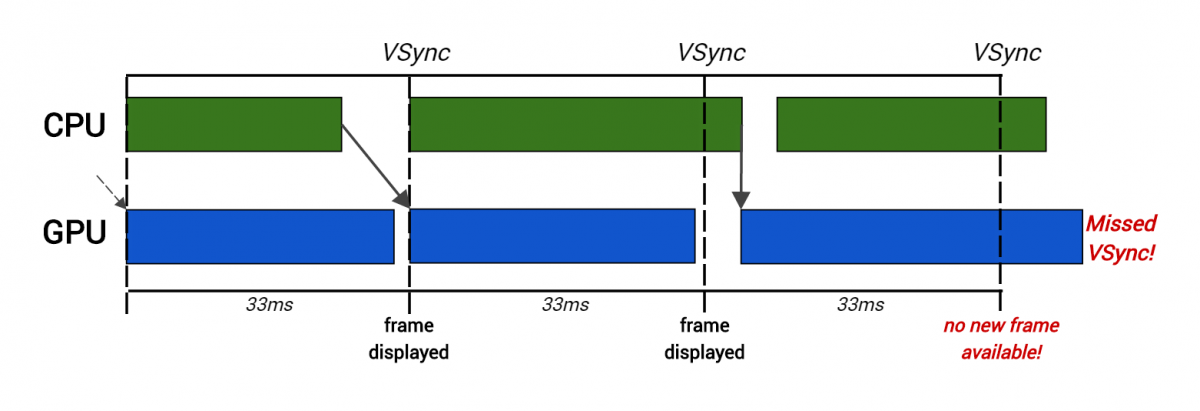 Here the CPU takes too long to produce rendering commands for the second frame, so the GPU starts rendering late and thus misses VSync.
To display a mesh, the CPU issues a draw call which is simply a series of commands that tells the GPU what to draw and how to draw it. As the draw call goes through the GPU pipeline, it uses the various configurable settings specified in the draw call - mostly determined by the mesh's material and its parameters - to decide how the mesh is rendered. These settings, called GPU state, affect all aspects of rendering, and consist of everything the GPU needs to know in order to render an object. Most significantly for us, GPU state includes the current vertex/index buffers, the current vertex/pixel shader programs, and all the shader inputs (eg. MaterialTexture or LightColor in the above shader code example).
This means that to change a piece of GPU state (for example changing a texture or switching shaders), a new draw call must be issued. This matters because these draw calls are not free for the CPU. It costs a certain amount of time to set up the desired GPU state changes and then issue the draw call. Beyond whatever work the game engine needs to do for each call, extra error checking and bookkeeping cost is introduced by the graphics driver, an intermediate layer of code written by the GPU vendor (NVIDIA, AMD etc.) that translates the draw call into low-level hardware instructions. Too many draw calls can put too much of a burden on the CPU and cause serious performance problems.
Due to this overhead, we generally set an upper limit to the number of draw calls that are acceptable per frame. If this limit is exceeded during gameplay testing, steps must be taken such as reducing the number of objects, reducing draw distance, etc. Console games will typically try to keep draw calls in the 2000-3000 range (eg. on Far Cry Primal we tried to keep it below 2500 per frame). That might sound like a lot, but it also includes any special rendering techniques that might be employed - cascaded shadows for example can easily double the number of draw calls in a frame.
As mentioned above, GPU state can only be changed by issuing a new draw call. This means that although you may have created a single mesh in your modelling package, if one half of the mesh uses one texture for the albedo map and the other half uses a different texture, it will be rendered as two separate draw calls. The same goes if the mesh is made up of multiple materials; different shaders need to be set, so multiple draw calls must be issued.
In practice, a very common source of state change - and therefore extra draw calls - is switching texture maps. Typically the whole mesh will use the same material (and therefore the same shaders), but different parts of the mesh will use different sets of albedo/normal/roughness maps. With a scene of hundreds or even thousands of objects, using many draw calls for each object will cost a considerable amount of CPU time and so will have a noticeable impact on the framerate of the game.
To avoid this, a common solution is to combine all the different texture maps used on a mesh into a single big texture, often called an atlas. The UVs of the mesh are then adjusted to look up the right part of the atlas, and the entire mesh (or even multiple meshes) can be rendered in a single draw call. Care must be taken when constructing the atlas so that adjacent textures don't bleed into each other at lower mips, but these problems are relatively minor compared to the gains that can be had in terms of performance.
Here the CPU takes too long to produce rendering commands for the second frame, so the GPU starts rendering late and thus misses VSync.
To display a mesh, the CPU issues a draw call which is simply a series of commands that tells the GPU what to draw and how to draw it. As the draw call goes through the GPU pipeline, it uses the various configurable settings specified in the draw call - mostly determined by the mesh's material and its parameters - to decide how the mesh is rendered. These settings, called GPU state, affect all aspects of rendering, and consist of everything the GPU needs to know in order to render an object. Most significantly for us, GPU state includes the current vertex/index buffers, the current vertex/pixel shader programs, and all the shader inputs (eg. MaterialTexture or LightColor in the above shader code example).
This means that to change a piece of GPU state (for example changing a texture or switching shaders), a new draw call must be issued. This matters because these draw calls are not free for the CPU. It costs a certain amount of time to set up the desired GPU state changes and then issue the draw call. Beyond whatever work the game engine needs to do for each call, extra error checking and bookkeeping cost is introduced by the graphics driver, an intermediate layer of code written by the GPU vendor (NVIDIA, AMD etc.) that translates the draw call into low-level hardware instructions. Too many draw calls can put too much of a burden on the CPU and cause serious performance problems.
Due to this overhead, we generally set an upper limit to the number of draw calls that are acceptable per frame. If this limit is exceeded during gameplay testing, steps must be taken such as reducing the number of objects, reducing draw distance, etc. Console games will typically try to keep draw calls in the 2000-3000 range (eg. on Far Cry Primal we tried to keep it below 2500 per frame). That might sound like a lot, but it also includes any special rendering techniques that might be employed - cascaded shadows for example can easily double the number of draw calls in a frame.
As mentioned above, GPU state can only be changed by issuing a new draw call. This means that although you may have created a single mesh in your modelling package, if one half of the mesh uses one texture for the albedo map and the other half uses a different texture, it will be rendered as two separate draw calls. The same goes if the mesh is made up of multiple materials; different shaders need to be set, so multiple draw calls must be issued.
In practice, a very common source of state change - and therefore extra draw calls - is switching texture maps. Typically the whole mesh will use the same material (and therefore the same shaders), but different parts of the mesh will use different sets of albedo/normal/roughness maps. With a scene of hundreds or even thousands of objects, using many draw calls for each object will cost a considerable amount of CPU time and so will have a noticeable impact on the framerate of the game.
To avoid this, a common solution is to combine all the different texture maps used on a mesh into a single big texture, often called an atlas. The UVs of the mesh are then adjusted to look up the right part of the atlas, and the entire mesh (or even multiple meshes) can be rendered in a single draw call. Care must be taken when constructing the atlas so that adjacent textures don't bleed into each other at lower mips, but these problems are relatively minor compared to the gains that can be had in terms of performance.
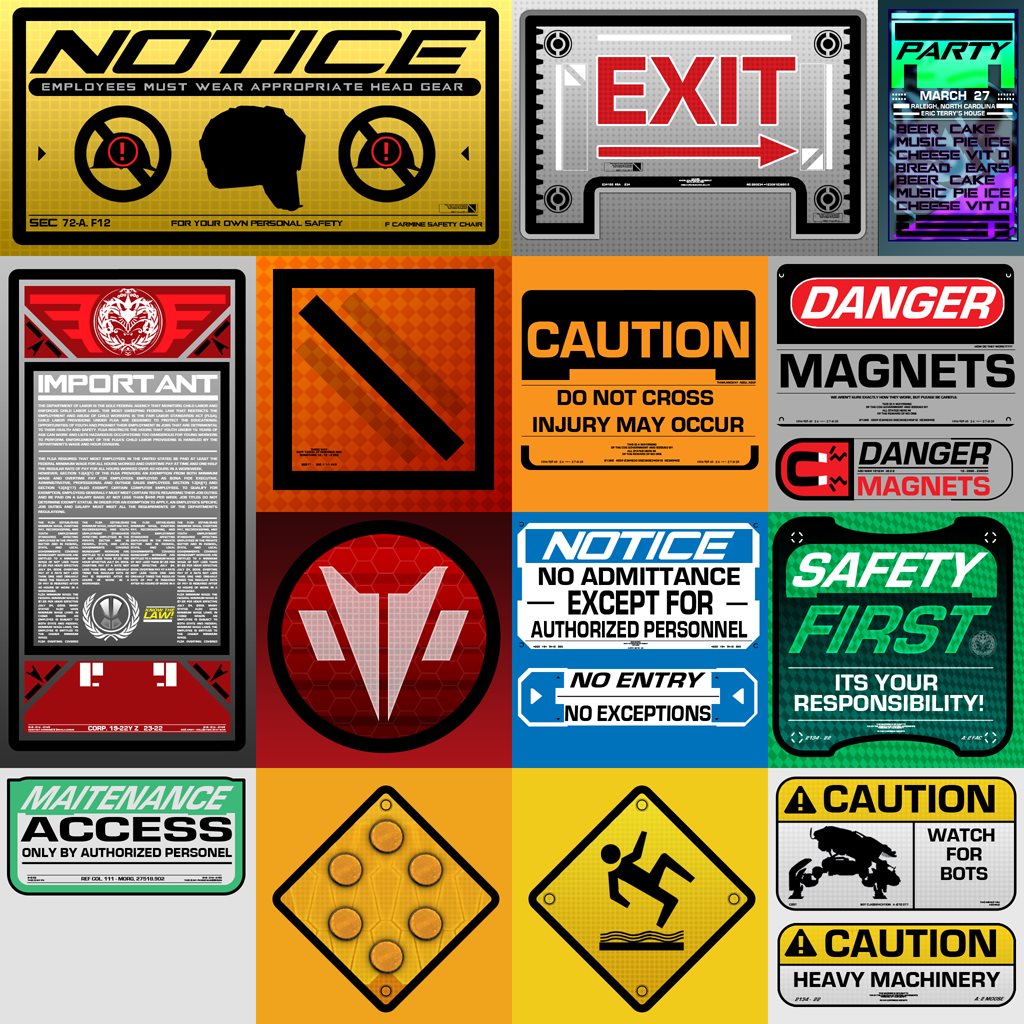 A texture atlas from Unreal Engine's Infiltrator demo
Many engines also support instancing, also known as batching or clustering. This is the ability to use a single draw call to render multiple objects that are mostly identical in terms of shaders and state, and only differ in a restricted set of ways (typically their position and rotation in the world). The engine will usually recognize when multiple identical objects can be rendered using instancing, so it's always preferable to use the same object multiple times in a scene when possible, instead of multiple different objects that will need to be rendered with separate draw calls.
Another common technique for reducing draw calls is manually merging many different objects that share the same material into a single mesh. This can be effective, but care must be taken to avoid excessive merging which can actually worsen performance by increasing the amount of work for the GPU. Before any draw call gets issued, the engine's visibility system will determine whether or not the object will even appear on screen. If not, it's very cheap to just ignore the object at this early stage and not pay for any draw call or GPU work (also known as visibility culling). This is usually done by checking if the object's bounding volume is visible from the camera's point of view, and that it is not completely blocked from view (occluded) by any other objects.
However, when multiple meshes are merged into a single object, their individual bounding volumes must be combined into a single large volume that is big enough to enclose every mesh. This increases the likelihood that the visibility system will be able to see some part of the volume, and so will consider the entire collection visible. That means that it becomes a draw call, and so the vertex shader must be executed on every vertex in the object - even if very few of those vertices actually appear on the screen. This can lead to a lot of GPU time being wasted because the vertices end up not contributing anything to the final image. For these reasons, mesh merging is the most effective when it is done on groups of small objects that are close to each other, as they will probably be on-screen at the same time anyway.
A texture atlas from Unreal Engine's Infiltrator demo
Many engines also support instancing, also known as batching or clustering. This is the ability to use a single draw call to render multiple objects that are mostly identical in terms of shaders and state, and only differ in a restricted set of ways (typically their position and rotation in the world). The engine will usually recognize when multiple identical objects can be rendered using instancing, so it's always preferable to use the same object multiple times in a scene when possible, instead of multiple different objects that will need to be rendered with separate draw calls.
Another common technique for reducing draw calls is manually merging many different objects that share the same material into a single mesh. This can be effective, but care must be taken to avoid excessive merging which can actually worsen performance by increasing the amount of work for the GPU. Before any draw call gets issued, the engine's visibility system will determine whether or not the object will even appear on screen. If not, it's very cheap to just ignore the object at this early stage and not pay for any draw call or GPU work (also known as visibility culling). This is usually done by checking if the object's bounding volume is visible from the camera's point of view, and that it is not completely blocked from view (occluded) by any other objects.
However, when multiple meshes are merged into a single object, their individual bounding volumes must be combined into a single large volume that is big enough to enclose every mesh. This increases the likelihood that the visibility system will be able to see some part of the volume, and so will consider the entire collection visible. That means that it becomes a draw call, and so the vertex shader must be executed on every vertex in the object - even if very few of those vertices actually appear on the screen. This can lead to a lot of GPU time being wasted because the vertices end up not contributing anything to the final image. For these reasons, mesh merging is the most effective when it is done on groups of small objects that are close to each other, as they will probably be on-screen at the same time anyway.
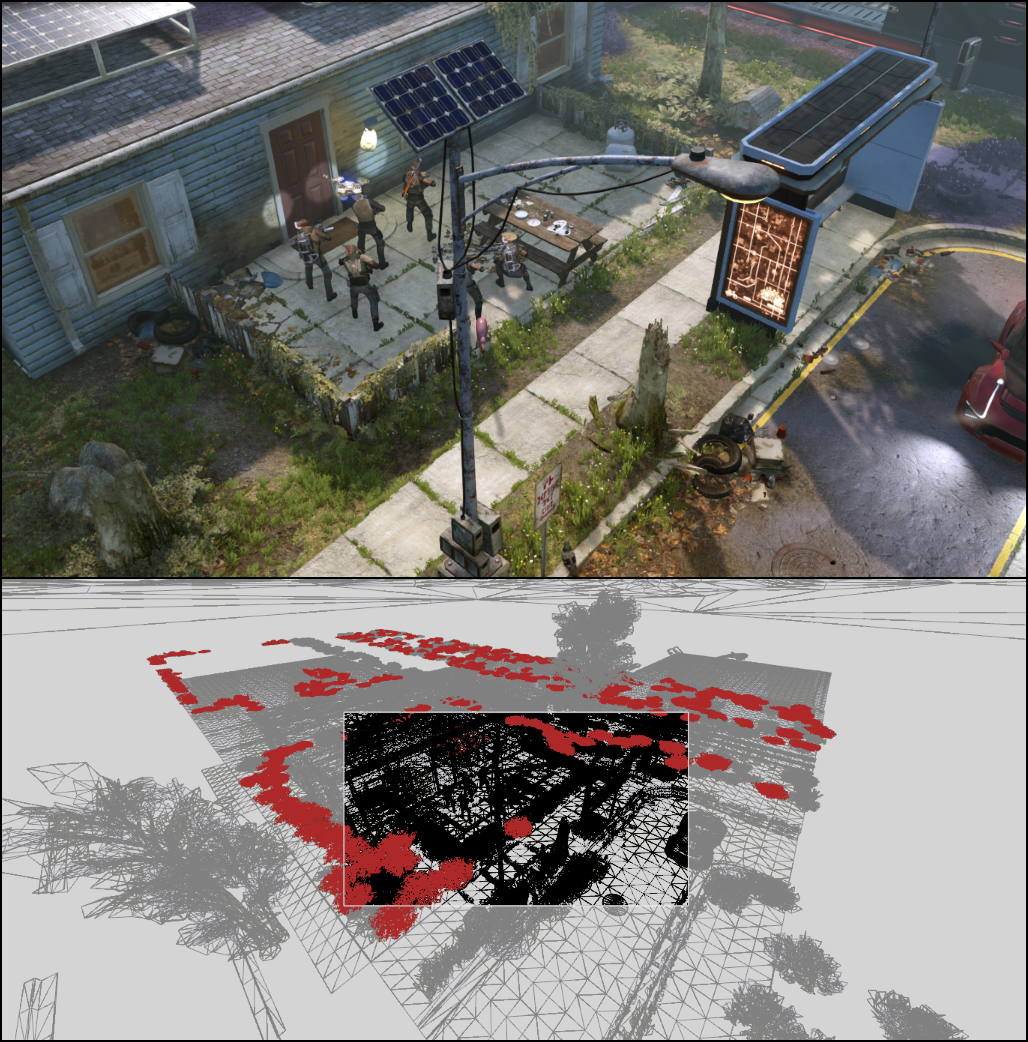 A frame from XCOM 2 as captured with RenderDoc. The wireframe (bottom) shows in grey all the extra geometry submitted to the GPU that is outside the view of the in-game camera.
As an illustrative example take the above capture of XCOM 2, one of my favourite games of the last couple of years. The wireframe shows the entire scene as submitted to the GPU by the engine, with the black area in the middle being the geometry that's actually visible by the game camera. All the surrounding geometry in grey is not visible and will be culled after the vertex shader is executed, which is all wasted GPU time. In particular, note the highlighted red geometry which is a series of bush meshes, combined and rendered in just a few draw calls. Since the visibility system determined that at least some of the bushes are visible on the screen, they are all rendered and so must all have their vertex shader executed before determining which can be culled... which turns out to be most of them.
Please note this isn't an indictment of XCOM 2 in particular, I just happened to be playing it while writing this article! Every game has this problem, and it's a constant battle to balance the CPU cost of doing more accurate visibility tests, the GPU cost of culling the invisible geometry, and the CPU cost of having more draw calls.
Things are changing when it comes to the cost of draw calls however. As mentioned above, a significant reason for their expense is the overhead of the driver doing translation and error checking. This has long been the case, but the most modern graphics APIs (eg. Direct3D 12 and Vulkan) have been restructured in order to avoid most of this overhead. While this does introduce extra complexity to the game's rendering engine, it can also result in cheaper draw calls, allowing us to render many more objects than before possible. Some engines (most notably the latest version used by Assassin's Creed) have even gone in a radically different direction, using the capabilities of the latest GPUs to drive rendering and effectively doing away with draw calls altogether.
The performance impact of having too many draw calls is mostly on the CPU; pretty much all other performance issues related to art assets are on the GPU. We'll now look at what a bottleneck is, where they can happen, and what we can do about them.
A frame from XCOM 2 as captured with RenderDoc. The wireframe (bottom) shows in grey all the extra geometry submitted to the GPU that is outside the view of the in-game camera.
As an illustrative example take the above capture of XCOM 2, one of my favourite games of the last couple of years. The wireframe shows the entire scene as submitted to the GPU by the engine, with the black area in the middle being the geometry that's actually visible by the game camera. All the surrounding geometry in grey is not visible and will be culled after the vertex shader is executed, which is all wasted GPU time. In particular, note the highlighted red geometry which is a series of bush meshes, combined and rendered in just a few draw calls. Since the visibility system determined that at least some of the bushes are visible on the screen, they are all rendered and so must all have their vertex shader executed before determining which can be culled... which turns out to be most of them.
Please note this isn't an indictment of XCOM 2 in particular, I just happened to be playing it while writing this article! Every game has this problem, and it's a constant battle to balance the CPU cost of doing more accurate visibility tests, the GPU cost of culling the invisible geometry, and the CPU cost of having more draw calls.
Things are changing when it comes to the cost of draw calls however. As mentioned above, a significant reason for their expense is the overhead of the driver doing translation and error checking. This has long been the case, but the most modern graphics APIs (eg. Direct3D 12 and Vulkan) have been restructured in order to avoid most of this overhead. While this does introduce extra complexity to the game's rendering engine, it can also result in cheaper draw calls, allowing us to render many more objects than before possible. Some engines (most notably the latest version used by Assassin's Creed) have even gone in a radically different direction, using the capabilities of the latest GPUs to drive rendering and effectively doing away with draw calls altogether.
The performance impact of having too many draw calls is mostly on the CPU; pretty much all other performance issues related to art assets are on the GPU. We'll now look at what a bottleneck is, where they can happen, and what we can do about them.
Part 2: Common GPU bottlenecks
The very first step in optimization is to identify the current bottleneck so you can take steps to reduce or eliminate it. A bottleneck refers to the section of the pipeline that is slowing everything else down. In the above case where too many draw calls are costing too much, the CPU is the bottleneck. Even if we performed other optimizations that made the GPU faster, it wouldn't matter to the framerate because the CPU is still running too slowly to produce a frame in the required amount of time.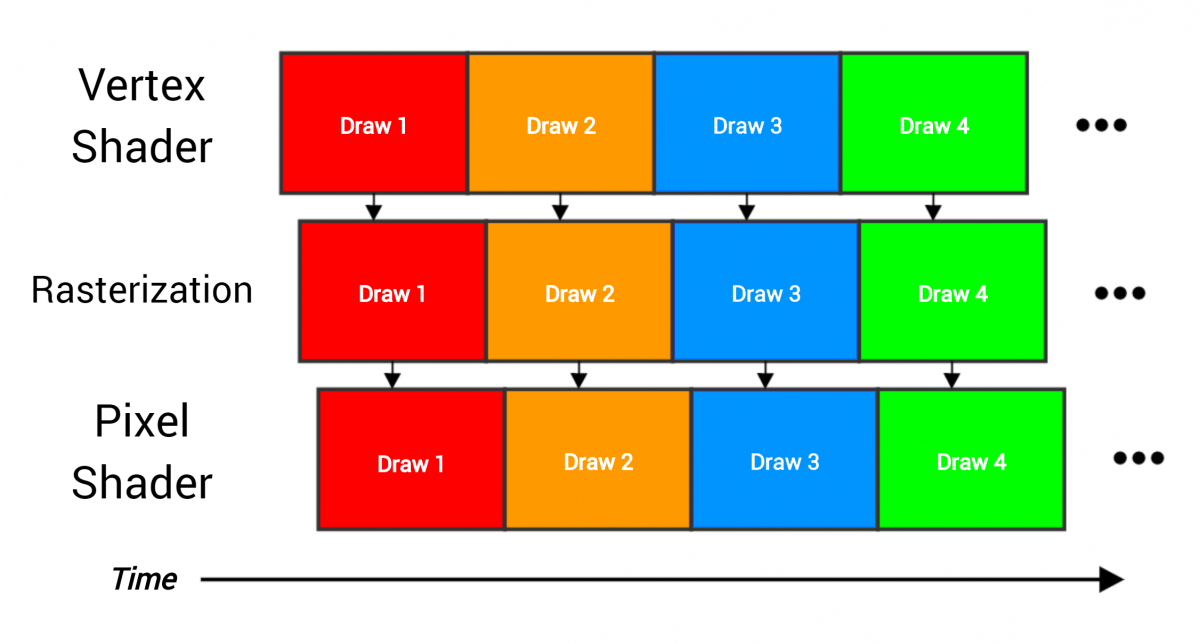 4 draw calls going through the pipeline, each being the rendering of a full mesh containing many triangles. The stages overlap because as soon as one piece of work is finished it can be immediately passed to the next stage (eg. when three vertices are processed by the vertex shader then the triangle can proceed to be rasterized).
You can think of the GPU pipeline as an assembly line. As each stage finishes with its data, it forwards the results to the following stage and proceeds with the next piece of work. Ideally every stage is busy working all the time, and the hardware is being utilized fully and efficiently as represented in the above image - the vertex shader is constantly processing vertices, the rasterizer is constantly rasterizing pixels, and so on. But consider what happens if one stage takes much longer than the others:
4 draw calls going through the pipeline, each being the rendering of a full mesh containing many triangles. The stages overlap because as soon as one piece of work is finished it can be immediately passed to the next stage (eg. when three vertices are processed by the vertex shader then the triangle can proceed to be rasterized).
You can think of the GPU pipeline as an assembly line. As each stage finishes with its data, it forwards the results to the following stage and proceeds with the next piece of work. Ideally every stage is busy working all the time, and the hardware is being utilized fully and efficiently as represented in the above image - the vertex shader is constantly processing vertices, the rasterizer is constantly rasterizing pixels, and so on. But consider what happens if one stage takes much longer than the others:
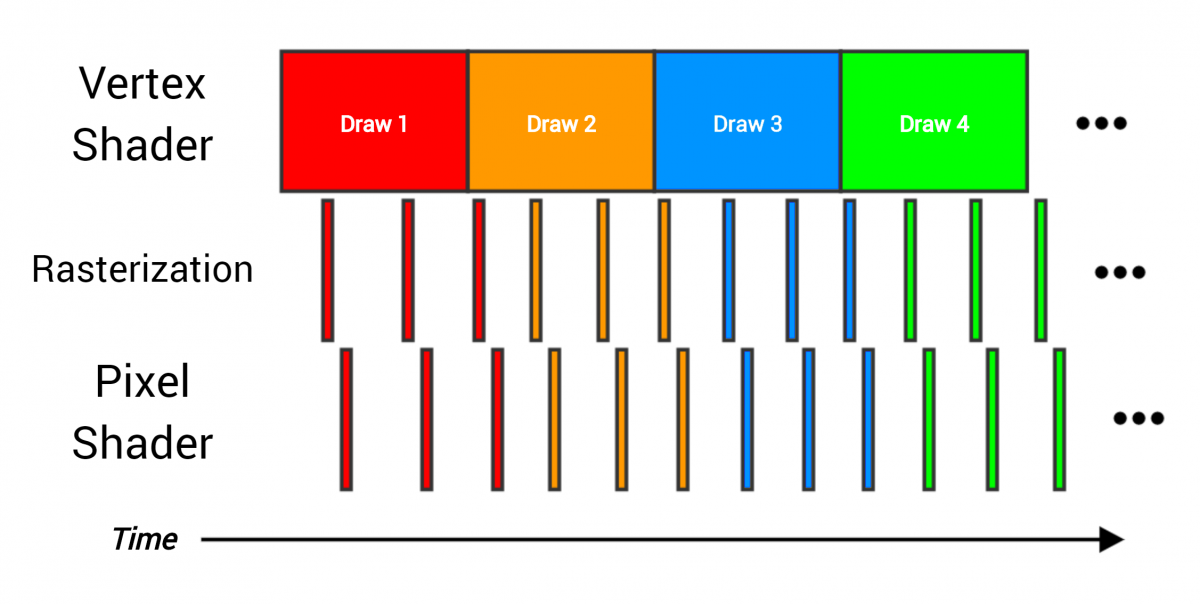 What happens here is that an expensive vertex shader can't feed the following stages fast enough, and so becomes the bottleneck. If you had a draw call that behaved like this, making the pixel shader faster is not going to make much of a difference to the time it takes for the entire draw call to be rendered. The only way to make things faster is to reduce the time spent in the vertex shader. How we do that depends on what in the vertex shader stage is actually causing the bottleneck.
You should keep in mind that there will almost always be a bottleneck of some kind - if you eliminate one, another will just take its place. The trick is knowing when you can do something about it, and when you have to live with it because that's just what it costs to render what you want to render. When you optimize, you're really trying to get rid of unnecessary bottlenecks. But how do you identify what the bottleneck is?
What happens here is that an expensive vertex shader can't feed the following stages fast enough, and so becomes the bottleneck. If you had a draw call that behaved like this, making the pixel shader faster is not going to make much of a difference to the time it takes for the entire draw call to be rendered. The only way to make things faster is to reduce the time spent in the vertex shader. How we do that depends on what in the vertex shader stage is actually causing the bottleneck.
You should keep in mind that there will almost always be a bottleneck of some kind - if you eliminate one, another will just take its place. The trick is knowing when you can do something about it, and when you have to live with it because that's just what it costs to render what you want to render. When you optimize, you're really trying to get rid of unnecessary bottlenecks. But how do you identify what the bottleneck is?
Profiling
Profiling tools are absolutely essential for figuring out where all the GPU's time is being spent, and good ones will point you at exactly what you need to change in order for things to go faster. They do this in a variety of ways - some explicitly show a list of bottlenecks, others let you run 'experiments' to see what happens (eg. "how does my draw time change if all the textures are tiny", which can tell you if you're bound by memory bandwidth or cache usage). Unfortunately this is where things get a bit hand-wavy, because some of the best performance tools available are only available for the consoles and therefore under NDA. If you're developing for Xbox or Playstation, bug your friendly neighbourhood graphics programmer to show you these tools. We love it when artists get involved in performance, and will be happy to answer questions and even host tutorials on how to use the tools effectively.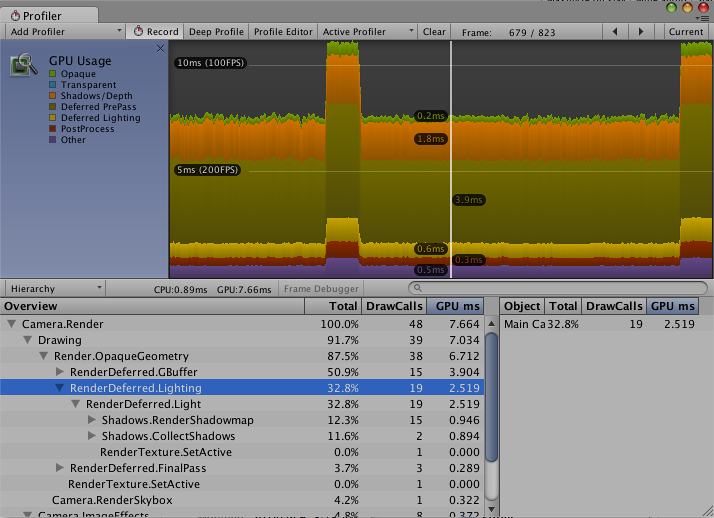 Unity's basic built-in GPU profiler
The PC already has some pretty good (albeit hardware-specific) profiling tools which you can get directly from the GPU vendors, such as NVIDIA's Nsight, AMD's GPU PerfStudio, and Intel's GPA. Then there's RenderDoc which is currently the best tool for graphics debugging on PC, but doesn't have any advanced profiling features. Microsoft is also starting to release its awesome Xbox profiling tool PIX for Windows too, albeit only for D3D12 applications. Assuming they also plan to provide the same bottleneck analysis tools as the Xbox version (tricky with the wide variety of hardware out there), it should be a huge asset to PC developers going forward.
These tools can give you more information about the performance of your art than you will ever need. They can also give you a lot of insight into how a frame is put together in your engine, as well as being awesome debugging tools for when things don't look how they should.
Being able to use them is important, as artists need to be responsible for the performance of their art. But you shouldn't be expected to figure it all out on your own - any good engine should provide its own custom tools for analyzing performance, ideally providing metrics and guidelines to help determine if your art assets are within budget. If you want to be more involved with performance but feel you don't have the necessary tools, talk to your programming team. Chances are they already exist - and if they don't, they should be created!
Now that you know how GPUs work and what a bottleneck is, we can finally get to the good stuff. Let's dig into the most common real-world bottlenecks that can show up in the pipeline, how they happen, and what can be done about them.
Unity's basic built-in GPU profiler
The PC already has some pretty good (albeit hardware-specific) profiling tools which you can get directly from the GPU vendors, such as NVIDIA's Nsight, AMD's GPU PerfStudio, and Intel's GPA. Then there's RenderDoc which is currently the best tool for graphics debugging on PC, but doesn't have any advanced profiling features. Microsoft is also starting to release its awesome Xbox profiling tool PIX for Windows too, albeit only for D3D12 applications. Assuming they also plan to provide the same bottleneck analysis tools as the Xbox version (tricky with the wide variety of hardware out there), it should be a huge asset to PC developers going forward.
These tools can give you more information about the performance of your art than you will ever need. They can also give you a lot of insight into how a frame is put together in your engine, as well as being awesome debugging tools for when things don't look how they should.
Being able to use them is important, as artists need to be responsible for the performance of their art. But you shouldn't be expected to figure it all out on your own - any good engine should provide its own custom tools for analyzing performance, ideally providing metrics and guidelines to help determine if your art assets are within budget. If you want to be more involved with performance but feel you don't have the necessary tools, talk to your programming team. Chances are they already exist - and if they don't, they should be created!
Now that you know how GPUs work and what a bottleneck is, we can finally get to the good stuff. Let's dig into the most common real-world bottlenecks that can show up in the pipeline, how they happen, and what can be done about them.
Shader instructions
Since most of the GPU's work is done with shaders, they're often the source of many bottlenecks of the you'll see. When a bottleneck is identified as shader instructions (sometimes referred to as ALUs from Arithmetic Logic Units, the hardware that actually does the calculations), it's simply a way of saying the vertex or pixel shader is doing a lot of work and the rest of the pipeline is waiting for that work to finish. Often the vertex or pixel shader program itself is just too complex, containing many instructions and taking a long time to execute. Or maybe the vertex shader is reasonable but the mesh you're rendering has too many vertices which adds up to a lot of time spent executing the vertex shader. Or the draw call covers a large area of the screen touching many pixels, and so spends a lot of time in the pixel shader. Unsurprisingly, the best way to optimize a shader instruction bottleneck is to execute less instructions! For pixel shaders that means choosing a simpler material with less features to reduce the number of instructions executed per pixel. For vertex shaders it means simplifying your mesh to reduce the number of vertices that need to be processed, as well as being sure to use LODs (Level Of Detail - simplified versions of your mesh for use when the object is far away and small on the screen). Sometimes however, shader instruction bottlenecks are instead just an indication of problems in some other area. Issues such as too much overdraw, a misbehaving LOD system, and many others can cause the GPU to do a lot more work than necessary. These problems can be either on the engine side or the content side; careful profiling, examination, and experience will help you to figure out what's really going on. One of the most common of these issues - overdraw - is when the same pixel on the screen needs to be shaded multiple times, because it's touched by multiple draw calls. Overdraw is a problem because it decreases the overall time the GPU has to spend on rendering. If every pixel on the screen has to be shaded twice, the GPU can only spend half the amount of time on each pixel and still maintain the same framerate.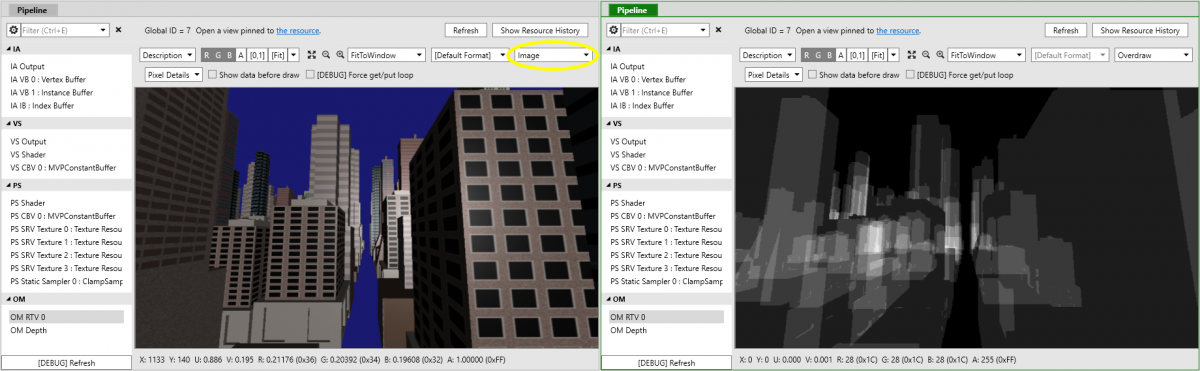 A frame capture from PIX with the corresponding overdraw visualization mode
Sometimes overdraw is unavoidable, such as when rendering translucent objects like particles or glass-like materials; the background object is visible through the foreground, so both need to be rendered. But for opaque objects, overdraw is completely unnecessary because the pixel shown in the buffer at the end of rendering is the only one that actually needs to be processed. In this case, every overdrawn pixel is just wasted GPU time.
Steps are taken by the GPU to reduce overdraw in opaque objects. The early depth test (which happens before the pixel shader - see the initial pipeline diagram) will skip pixel shading if it determines that the pixel will be hidden by another object. It does that by comparing the pixel being shaded to the depth buffer - a render target where the GPU stores the entire frame's depth so that objects occlude each other properly. But for the early depth test to be effective, the other object must have already been rendered so it is present in the depth buffer. That means that the rendering order of objects is very important.
Ideally every scene would be rendered front-to-back (ie. objects closest to the camera first), so that only the foreground pixels get shaded and the rest get killed by the early depth test, eliminating overdraw entirely. But in the real world that's not always possible because you can't reorder the triangles inside a draw call during rendering. Complex meshes can occlude themselves multiple times, or mesh merging can result in many overlapping objects being rendered in the "wrong" order causing overdraw. There's no easy answer for avoiding these cases, and in the latter case it's just another thing to take into consideration when deciding whether or not to merge meshes.
To help early depth testing, some games do a partial depth prepass. This is a preliminary pass where certain large objects that are known to be effective occluders (large buildings, terrain, the main character etc.) are rendered with a simple shader that only outputs to the depth buffer, which is relatively fast as it avoids doing any pixel shader work such as lighting or texturing. This 'primes' the depth buffer and increases the amount of pixel shader work that can be skipped during the full rendering pass later in the frame. The drawback is that rendering the occluding objects twice (once in the depth-only pass and once in the main pass) increases the number of draw calls, plus there's always a chance that the time it takes to render the depth pass itself is more than the time it saves from increased early depth test efficiency. Only profiling in a variety of cases can determine whether or not it's worth it for any given scene.
A frame capture from PIX with the corresponding overdraw visualization mode
Sometimes overdraw is unavoidable, such as when rendering translucent objects like particles or glass-like materials; the background object is visible through the foreground, so both need to be rendered. But for opaque objects, overdraw is completely unnecessary because the pixel shown in the buffer at the end of rendering is the only one that actually needs to be processed. In this case, every overdrawn pixel is just wasted GPU time.
Steps are taken by the GPU to reduce overdraw in opaque objects. The early depth test (which happens before the pixel shader - see the initial pipeline diagram) will skip pixel shading if it determines that the pixel will be hidden by another object. It does that by comparing the pixel being shaded to the depth buffer - a render target where the GPU stores the entire frame's depth so that objects occlude each other properly. But for the early depth test to be effective, the other object must have already been rendered so it is present in the depth buffer. That means that the rendering order of objects is very important.
Ideally every scene would be rendered front-to-back (ie. objects closest to the camera first), so that only the foreground pixels get shaded and the rest get killed by the early depth test, eliminating overdraw entirely. But in the real world that's not always possible because you can't reorder the triangles inside a draw call during rendering. Complex meshes can occlude themselves multiple times, or mesh merging can result in many overlapping objects being rendered in the "wrong" order causing overdraw. There's no easy answer for avoiding these cases, and in the latter case it's just another thing to take into consideration when deciding whether or not to merge meshes.
To help early depth testing, some games do a partial depth prepass. This is a preliminary pass where certain large objects that are known to be effective occluders (large buildings, terrain, the main character etc.) are rendered with a simple shader that only outputs to the depth buffer, which is relatively fast as it avoids doing any pixel shader work such as lighting or texturing. This 'primes' the depth buffer and increases the amount of pixel shader work that can be skipped during the full rendering pass later in the frame. The drawback is that rendering the occluding objects twice (once in the depth-only pass and once in the main pass) increases the number of draw calls, plus there's always a chance that the time it takes to render the depth pass itself is more than the time it saves from increased early depth test efficiency. Only profiling in a variety of cases can determine whether or not it's worth it for any given scene.
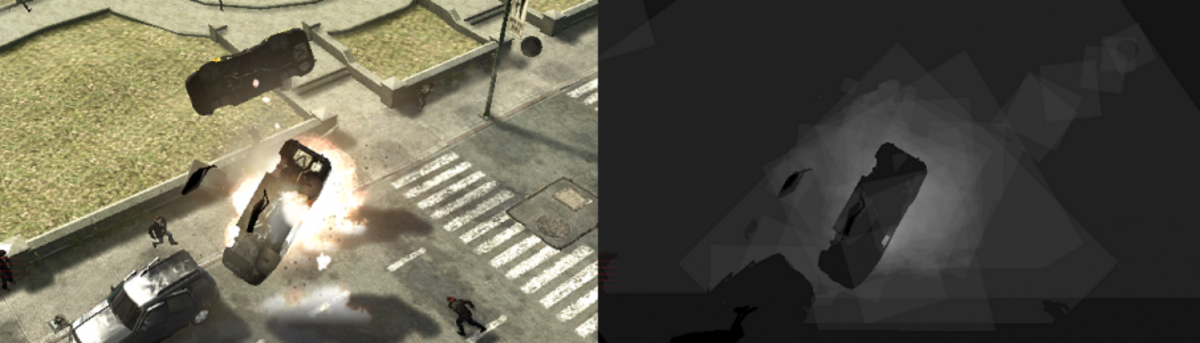 Particle overdraw visualization of an explosion in Prototype 2
One place where overdraw is a particular concern is particle rendering, given that particles are transparent and often overlap a lot. Artists working on particle effects should always have overdraw in mind when producing effects. A dense cloud effect can be produced by emitting lots of small faint overlapping particles, but that's going to drive up the rendering cost of the effect; a better-performing alternative would be to emit fewer large particles, and instead rely more on the texture and texture animation to convey the density of the effect. The overall result is often more visually effective anyway because offline software like FumeFX and Houdini can usually produce much more interesting effects through texture animation, compared to real-time simulated behaviour of individual particles.
The engine can also take steps to avoid doing more GPU work than necessary for particles. Every rendered pixel that ends up completely transparent is just wasted time, so a common optimization is to perform particle trimming: instead of rendering the particle with two triangles, a custom-fitted polygon is generated that minimizes the empty areas of the texture that are used.
Particle overdraw visualization of an explosion in Prototype 2
One place where overdraw is a particular concern is particle rendering, given that particles are transparent and often overlap a lot. Artists working on particle effects should always have overdraw in mind when producing effects. A dense cloud effect can be produced by emitting lots of small faint overlapping particles, but that's going to drive up the rendering cost of the effect; a better-performing alternative would be to emit fewer large particles, and instead rely more on the texture and texture animation to convey the density of the effect. The overall result is often more visually effective anyway because offline software like FumeFX and Houdini can usually produce much more interesting effects through texture animation, compared to real-time simulated behaviour of individual particles.
The engine can also take steps to avoid doing more GPU work than necessary for particles. Every rendered pixel that ends up completely transparent is just wasted time, so a common optimization is to perform particle trimming: instead of rendering the particle with two triangles, a custom-fitted polygon is generated that minimizes the empty areas of the texture that are used.
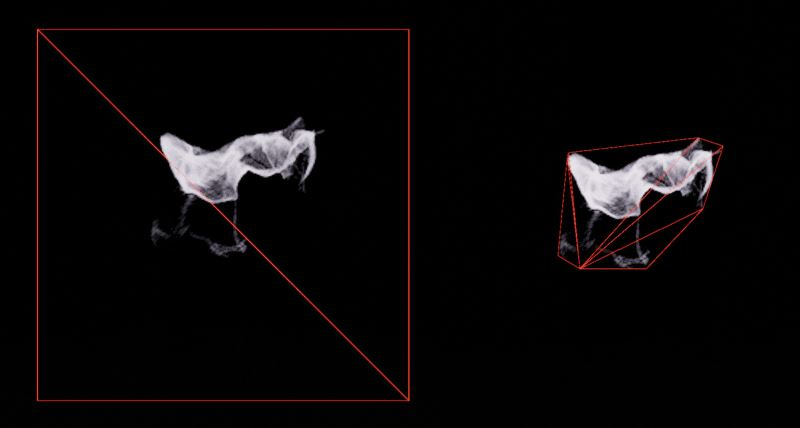 Particle 'cutout' tool in Unreal Engine 4
The same can be done for other partially transparent objects such as vegetation. In fact for vegetation it's even more important to use custom geometry to eliminate the large amount of empty texture space, as vegetation often uses alpha testing. This is when the alpha channel of the texture is used to decide whether or not to discard the pixel during the pixel shader stage, effectively making it transparent. This is a problem because alpha testing can also have the side effect of disabling the early depth test completely (because it invalidates certain assumptions that the GPU can make about the pixel), leading to much more unnecessary pixel shader work. Combine this with the fact that vegetation often contains a lot of overdraw anyway - think of all the overlapping leaves on a tree - and it can quickly become very expensive to render if you're not careful.
A close relative of overdraw is overshading, which is caused by tiny or thin triangles and can really hurt performance by wasting a significant portion of the GPU's time. Overshading is a consequence of how GPUs process pixels during pixel shading: not one at a time, but instead in 'quads' which are blocks of four pixels arranged in a 2x2 pattern. It's done like this so the hardware can do things like comparing UVs between pixels to calculate appropriate mipmap levels.
This means that if a triangle only touches a single pixel of a quad (because the triangle is tiny or very thin), the GPU still processes the whole quad and just throws away the other three pixels, wasting 75% of the work. That wasted time can really add up, and is particularly painful for forward (ie. not deferred) renderers that do all lighting and shading in a single pass in the pixel shader. This penalty can be reduced by using properly-tuned LODs; besides saving on vertex shader processing, they can also greatly reduce overshading by having triangles cover more of each quad on average.'
Particle 'cutout' tool in Unreal Engine 4
The same can be done for other partially transparent objects such as vegetation. In fact for vegetation it's even more important to use custom geometry to eliminate the large amount of empty texture space, as vegetation often uses alpha testing. This is when the alpha channel of the texture is used to decide whether or not to discard the pixel during the pixel shader stage, effectively making it transparent. This is a problem because alpha testing can also have the side effect of disabling the early depth test completely (because it invalidates certain assumptions that the GPU can make about the pixel), leading to much more unnecessary pixel shader work. Combine this with the fact that vegetation often contains a lot of overdraw anyway - think of all the overlapping leaves on a tree - and it can quickly become very expensive to render if you're not careful.
A close relative of overdraw is overshading, which is caused by tiny or thin triangles and can really hurt performance by wasting a significant portion of the GPU's time. Overshading is a consequence of how GPUs process pixels during pixel shading: not one at a time, but instead in 'quads' which are blocks of four pixels arranged in a 2x2 pattern. It's done like this so the hardware can do things like comparing UVs between pixels to calculate appropriate mipmap levels.
This means that if a triangle only touches a single pixel of a quad (because the triangle is tiny or very thin), the GPU still processes the whole quad and just throws away the other three pixels, wasting 75% of the work. That wasted time can really add up, and is particularly painful for forward (ie. not deferred) renderers that do all lighting and shading in a single pass in the pixel shader. This penalty can be reduced by using properly-tuned LODs; besides saving on vertex shader processing, they can also greatly reduce overshading by having triangles cover more of each quad on average.'
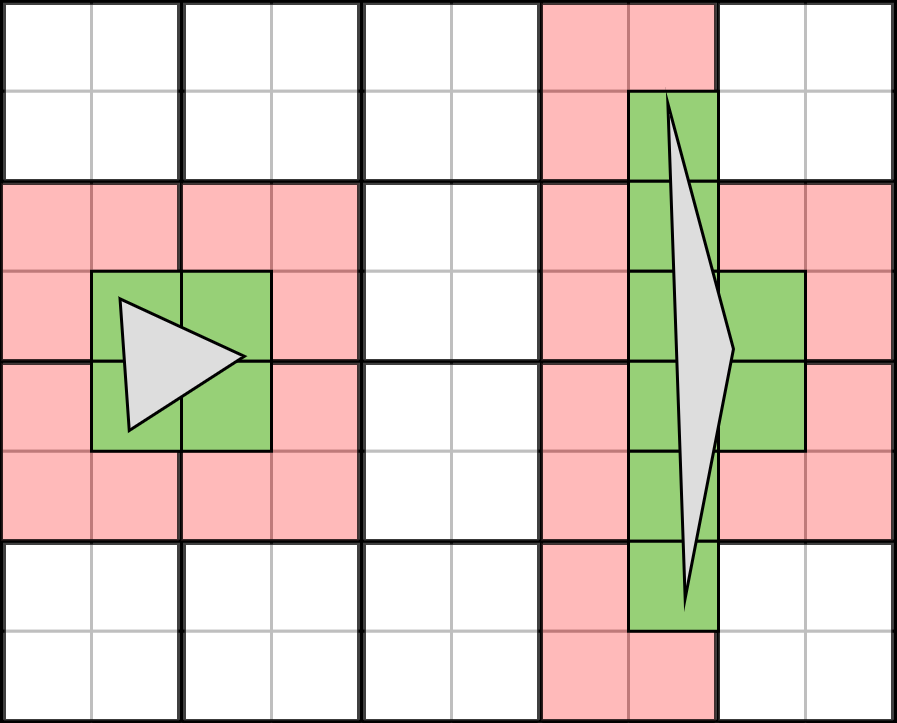 A 10x8 pixel buffer with 5x4 quads. The two triangles have poor quad utilization -- left is too small, right is too thin. The 10 red quads touched by the triangles need to be completely shaded, even though the 12 green pixels are the only ones that are actually needed. Overall, 70% of the GPU's work is wasted.
(Random trivia: quad overshading is also the reason you'll sometimes see fullscreen post effects use a single large triangle to cover the screen instead of two back-to-back triangles. With two triangles, quads that straddle the shared edge would be wasting some of their work, so avoiding that saves a minor amount of GPU time.)
Beyond overshading, tiny triangles are also a problem because GPUs can only process and rasterize triangles at a certain rate, which is usually relatively low compared to how many pixels it can process in the same amount of time. With too many small triangles, it can't produce pixels fast enough to keep the shader units busy, resulting in stalls and idle time - the real enemy of GPU performance.
Similarly, long thin triangles are bad for performance for another reason beyond quad usage: GPUs rasterize pixels in square or rectangular blocks, not in long strips. Compared to a more regular-shaped triangle with even sides, a long thin triangle ends up making the GPU do a lot of extra unnecessary work to rasterize it into pixels, potentially causing a bottleneck at the rasterization stage. This is why it's usually recommended that meshes are tessellated into evenly-shaped triangles, even if it increases the polygon count a bit. As with everything else, experimentation and profiling will show the best balance.
A 10x8 pixel buffer with 5x4 quads. The two triangles have poor quad utilization -- left is too small, right is too thin. The 10 red quads touched by the triangles need to be completely shaded, even though the 12 green pixels are the only ones that are actually needed. Overall, 70% of the GPU's work is wasted.
(Random trivia: quad overshading is also the reason you'll sometimes see fullscreen post effects use a single large triangle to cover the screen instead of two back-to-back triangles. With two triangles, quads that straddle the shared edge would be wasting some of their work, so avoiding that saves a minor amount of GPU time.)
Beyond overshading, tiny triangles are also a problem because GPUs can only process and rasterize triangles at a certain rate, which is usually relatively low compared to how many pixels it can process in the same amount of time. With too many small triangles, it can't produce pixels fast enough to keep the shader units busy, resulting in stalls and idle time - the real enemy of GPU performance.
Similarly, long thin triangles are bad for performance for another reason beyond quad usage: GPUs rasterize pixels in square or rectangular blocks, not in long strips. Compared to a more regular-shaped triangle with even sides, a long thin triangle ends up making the GPU do a lot of extra unnecessary work to rasterize it into pixels, potentially causing a bottleneck at the rasterization stage. This is why it's usually recommended that meshes are tessellated into evenly-shaped triangles, even if it increases the polygon count a bit. As with everything else, experimentation and profiling will show the best balance.
Memory Bandwidth and Textures
As illustrated in the above diagram of the GPU pipeline, meshes and textures are stored in memory that is physically separate from the GPU's shader processors. That means that whenever the GPU needs to access some piece of data, like a texture being fetched by a pixel shader, it needs to retrieve it from memory before it can actually use it as part of its calculations. Memory accesses are analogous to downloading files from the internet. File downloads take a certain amount of time due to the internet connection's bandwidth - the speed at which data can be transferred. That bandwidth is also shared between all downloads - if you can download one file at 6MB/s, two files only download at 3MB/s each. The same is true of memory accesses; index/vertex buffers and textures being accessed by the GPU take time, and must share memory bandwidth. The speeds are obviously much higher than internet connections - on paper the PS4's GPU memory bandwidth is 176GB/s - but the idea is the same. A shader that accesses many textures will rely heavily on having enough bandwidth to transfer all the data it needs in the time it needs it. Shaders programs are executed by the GPU with these restrictions in mind. A shader that needs to access a texture will try to start the transfer as early as possible, then do other unrelated work (for example lighting calculations) and hope that the texture data has arrived from memory by the time it gets to the part of the program that needs it. If the data hasn't arrived in time - because the transfer is slowed down by lots of other transfers, or because it runs out of other work to do (especially likely for dependent texture fetches) - execution will stop and it will just sit there and wait. This is a memory bandwidth bottleneck; making the rest of the shader faster will not matter if it still needs to stop and wait for data to arrive from memory. The only way to optimize this is to reduce the amount of bandwidth being used, or the amount of data being transferred, or both. Memory bandwidth might even have to be shared with the CPU or async compute work that the GPU is doing at the same time. It's a very precious resource. The majority of memory bandwidth is usually taken up by texture transfers, since textures contain so much data. As a result, there are a few different mechanisms in place to reduce the amount of texture data that needs to be shuffled around. Memory bandwidth might even have to be shared with the CPU or async compute work that the GPU is doing at the same time. It's a very precious resource. The majority of memory bandwidth is usually taken up by texture transfers, since textures contain so much data. As a result, there are a few different mechanisms in place to reduce the amount of texture data that needs to be shuffled around. First and foremost is a cache. This is a small piece of high-speed memory that the GPU has very fast access to, and is used to keep chunks of memory that have been accessed recently in case the GPU needs them again. In the internet connection analogy, the cache is your computer's hard drive that stores the downloaded files for faster access in the future. When a piece of memory is accessed, like a single texel in a texture, the surrounding texels are also pulled into the cache in the same memory transfer. The next time the GPU looks for one of those texels, it doesn't need to go all the way to memory and can instead fetch it from the cache extremely quickly. This is actually often the common case - when a texel is displayed on the screen in one pixel, it's very likely that the pixel beside it will need to show the same texel, or the texel right beside it in the texture. When that happens, nothing needs to be transferred from memory, no bandwidth is used, and the GPU can access the cached data almost instantly. Caches are therefore vitally important for avoiding memory-related bottlenecks. Especially when you take filtering into account - bilinear, trilinear, and anisotropic filtering all require multiple texels to be accessed for each lookup, putting an extra burden on bandwidth usage. High-quality anisotropic filtering is particularly bandwidth-intensive. Now think about what happens in the cache if you try to display a large texture (eg. 2048x2048) on an object that's very far away and only takes up a few pixels on the screen. Each pixel will need to fetch from a very different part of the texture, and the cache will be completely ineffective since it only keeps texels that were close to previous accesses. Every texture access will try to find its result in the cache and fail (called a 'cache miss') and so the data must be fetched from memory, incurring the dual costs of bandwidth usage and the time it takes for the data to be transferred. A stall may occur, slowing the whole shader down. It will also cause other (potentially useful) data to be 'evicted' from the cache in order to make room for the surrounding texels that will never even be used, reducing the overall efficiency of the cache. It's bad news all around, and that's not to even mention the visual quality issues - tiny movements of the camera will cause completely different texels to be sampled, causing aliasing and sparkling. This is where mipmapping comes to the rescue. When a texture fetch is issued, the GPU can analyze the texture coordinates being used at each pixel, determining when there is a large gap between texture accesses. Instead of incurring the costs of a cache miss for every texel, it instead accesses a lower mip of the texture that matches the resolution it's looking for. This greatly increases the effectiveness of the cache, reducing memory bandwidth usage and the potential for a bandwidth-related bottleneck. Lower mips are also smaller and need less data to be transferred from memory, further reducing bandwidth usage. And finally, since mips are pre-filtered, their use also vastly reduces aliasing and sparkling. For all of these reasons, it's almost always a good idea to use mipmaps - the advantages are definitely worth the extra memory usage.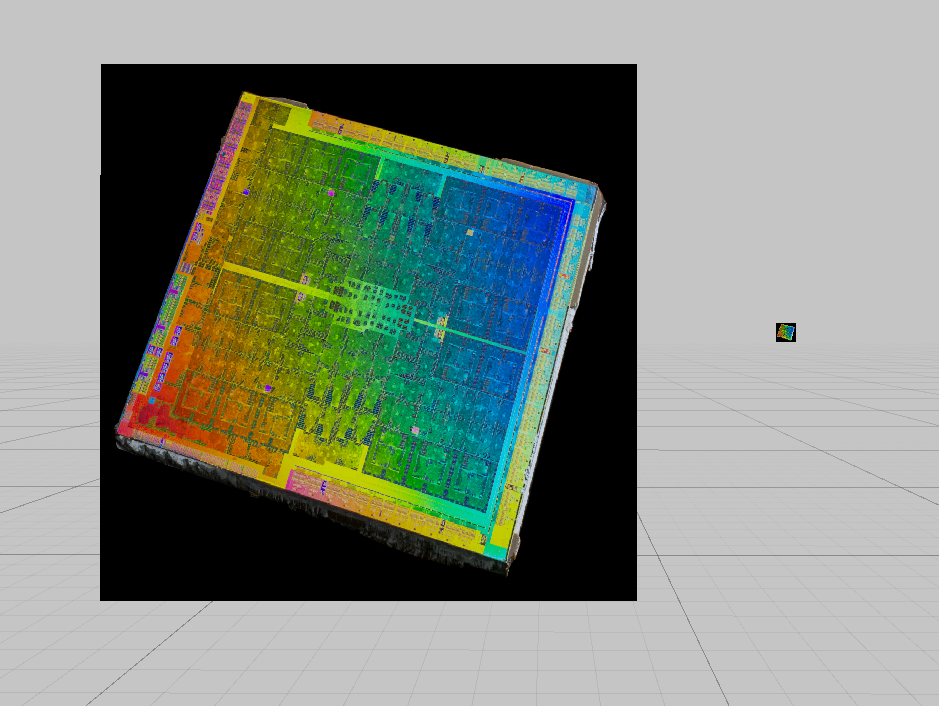 A texture on two quads, one close to the camera and one much further away
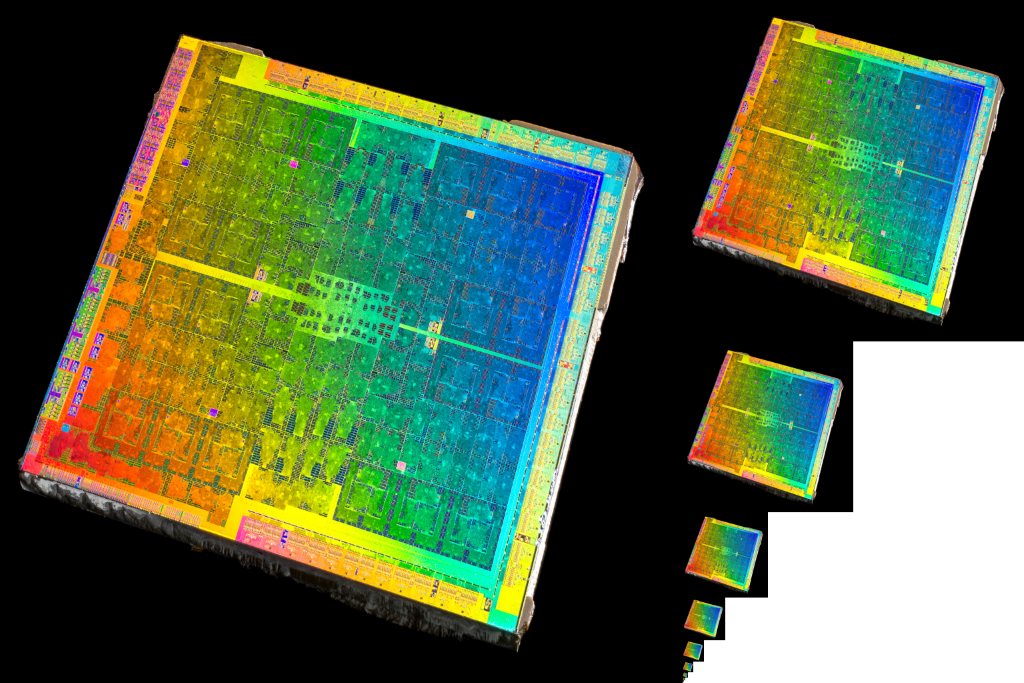 The same texture with a corresponding mipmap chain, each mip being half the size of the previous one
Lastly, texture compression is an important way of reducing bandwidth and cache usage (in addition to the obvious memory savings from storing less texture data). Using BC (Block Compression, previously known as DXT compression), textures can be reduced to a quarter or even a sixth of their original size in exchange for a minor hit in quality. This is a significant reduction in the amount of data that needs to be transferred and processed, and most GPUs even keep the textures compressed in the cache, leaving more room to store other texture data and increasing overall cache efficiency.
All of the above information should lead to some obvious steps for reducing or eliminating bandwidth bottlenecks when it comes to texture optimization on the art side. Make sure the textures have mips and are compressed. Don't use heavy 8x or 16x anisotropic filtering if 2x is enough, or even trilinear or bilinear if possible. Reduce texture resolution, particularly if the top-level mip is often displayed. Don't use material features that cause texture accesses unless the feature is really needed. And make sure all the data being fetched is actually used - don't sample four RGBA textures when you actually only need the data in the red channels of each; merge those four channels into a single texture and you've removed 75% of the bandwidth usage.
While textures are the primary users of memory bandwidth, they're by no means the only ones. Mesh data (vertex and index buffers) also need to be loaded from memory. You'll also notice in first GPU pipeline diagram that the final render target output is a write to memory. All these transfers usually share the same memory bandwidth.
In normal rendering these costs typically aren't noticeable as the amount of data is relatively small compared to the texture data, but this isn't always the case. Compared to regular draw calls, shadow passes behave quite differently and are much more likely to be bandwidth bound.
The same texture with a corresponding mipmap chain, each mip being half the size of the previous one
Lastly, texture compression is an important way of reducing bandwidth and cache usage (in addition to the obvious memory savings from storing less texture data). Using BC (Block Compression, previously known as DXT compression), textures can be reduced to a quarter or even a sixth of their original size in exchange for a minor hit in quality. This is a significant reduction in the amount of data that needs to be transferred and processed, and most GPUs even keep the textures compressed in the cache, leaving more room to store other texture data and increasing overall cache efficiency.
All of the above information should lead to some obvious steps for reducing or eliminating bandwidth bottlenecks when it comes to texture optimization on the art side. Make sure the textures have mips and are compressed. Don't use heavy 8x or 16x anisotropic filtering if 2x is enough, or even trilinear or bilinear if possible. Reduce texture resolution, particularly if the top-level mip is often displayed. Don't use material features that cause texture accesses unless the feature is really needed. And make sure all the data being fetched is actually used - don't sample four RGBA textures when you actually only need the data in the red channels of each; merge those four channels into a single texture and you've removed 75% of the bandwidth usage.
While textures are the primary users of memory bandwidth, they're by no means the only ones. Mesh data (vertex and index buffers) also need to be loaded from memory. You'll also notice in first GPU pipeline diagram that the final render target output is a write to memory. All these transfers usually share the same memory bandwidth.
In normal rendering these costs typically aren't noticeable as the amount of data is relatively small compared to the texture data, but this isn't always the case. Compared to regular draw calls, shadow passes behave quite differently and are much more likely to be bandwidth bound.
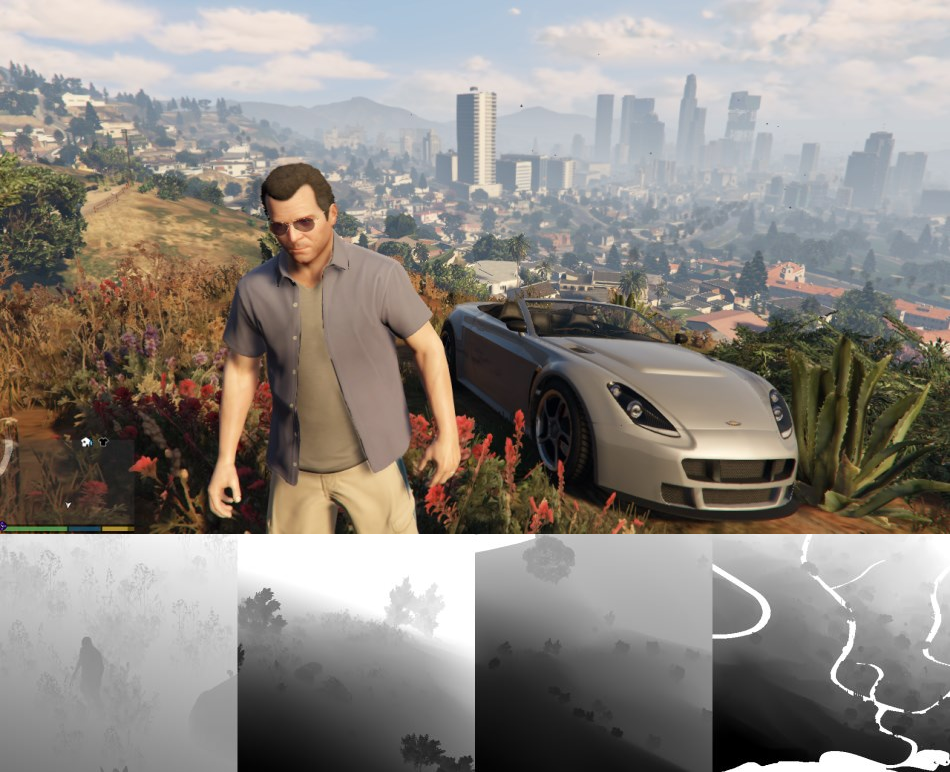 A frame from GTA V with shadow maps, courtesy of Adrian Courr?ges' great frame analysis
This is because shadow maps are simply depth buffer that represent the distance from the light to the closest mesh, so most of the work that needs to be done for shadow rendering consists of transferring data to and from memory: fetch the vertex/index buffers, do some simple calculations to determine position, and then write the depth of the mesh to the shadow map. Most of the time, a pixel shader isn't even executed because all the necessary depth information comes from just the vertex data. This leaves very little work to hide the overhead of all the memory transfers, and the likely bottleneck is that the shader just ends up waiting for memory transfers to complete. As a result, shadow passes are particularly sensitive to both vertex/triangle counts and shadow map resolution, as they directly affect the amount of bandwidth that is needed.
The last thing worth mentioning with regards to memory bandwidth is a special case - the Xbox. Both the Xbox 360 and Xbox One have a particular piece of memory embedded close to the GPU, called EDRAM on 360 and ESRAM on XB1. It's a relatively small amount of memory (10MB on 360 and 32MB on XB1), but big enough to store a few render targets and maybe some frequently-used textures, and with a much higher bandwidth than regular system memory (aka DRAM). Just as important as the speed is the fact that this bandwidth uses a dedicated path, so doesn't have to be shared with DRAM transfers. It adds complexity to the engine, but when used efficiently it can give some extra headroom in bandwidth-limited situations. As an artist you generally won't have control over what goes into EDRAM/ESRAM, but it's worth knowing of its existence when it comes to profiling. The 3D programming team can give you more details on its use in your particular engine.
A frame from GTA V with shadow maps, courtesy of Adrian Courr?ges' great frame analysis
This is because shadow maps are simply depth buffer that represent the distance from the light to the closest mesh, so most of the work that needs to be done for shadow rendering consists of transferring data to and from memory: fetch the vertex/index buffers, do some simple calculations to determine position, and then write the depth of the mesh to the shadow map. Most of the time, a pixel shader isn't even executed because all the necessary depth information comes from just the vertex data. This leaves very little work to hide the overhead of all the memory transfers, and the likely bottleneck is that the shader just ends up waiting for memory transfers to complete. As a result, shadow passes are particularly sensitive to both vertex/triangle counts and shadow map resolution, as they directly affect the amount of bandwidth that is needed.
The last thing worth mentioning with regards to memory bandwidth is a special case - the Xbox. Both the Xbox 360 and Xbox One have a particular piece of memory embedded close to the GPU, called EDRAM on 360 and ESRAM on XB1. It's a relatively small amount of memory (10MB on 360 and 32MB on XB1), but big enough to store a few render targets and maybe some frequently-used textures, and with a much higher bandwidth than regular system memory (aka DRAM). Just as important as the speed is the fact that this bandwidth uses a dedicated path, so doesn't have to be shared with DRAM transfers. It adds complexity to the engine, but when used efficiently it can give some extra headroom in bandwidth-limited situations. As an artist you generally won't have control over what goes into EDRAM/ESRAM, but it's worth knowing of its existence when it comes to profiling. The 3D programming team can give you more details on its use in your particular engine.
And there's more...
As you've probably gathered by now, GPUs are complex pieces of hardware. When fed properly, they are capable of processing an enormous amount of data and performing billions of calculations every second. On the other hand, bad data and poor usage can slow them down to a crawl, having a devastating effect on the game's framerate. There are many more things that could be discussed or expanded upon, but what's above is a good place to start for any technically-minded artist. Having an understanding of how the GPU works can help you produce art that not only looks great but also performs well... and better performance can let you improve your art even more, making the game look better too. There's a lot to take in here, but remember that your 3D programming team is always happy to sit down with you and discuss anything that needs more explanation - as am I in the comments section below!Further Technical Reading
- Render Hell - Simon Tr?mpler
- Texture filtering: mipmaps - Shawn Hargreaves
- Graphics Gems for Games - Findings from Avalanche Studios - Emil Persson
- Triangulation - Emil Persson
- How bad are small triangles on GPU and why? - Christophe Riccio
- Game Art Tricks - Simon Tr?mpler
- Optimizing the rendering of a particle system - Christer Ericson
- Practical Texture Atlases - Ivan-Assen Ivanov
- How GPUs Work - David Luebke & Greg Humphreys
- Casual Introduction to Low-Level Graphics Programming - Stephanie Hurlburt
- Counting Quads - Stephen Hill
- Overdraw in Overdrive - Stephen Hill
- Life of a triangle - NVIDIA's logical pipeline - NVIDIA
- From Shader Code to a Teraflop: How Shader Cores Work - Kayvon Fatahalian
- A Trip Through the Graphics Pipeline (2011) - Fabian Giesen


Good article. I think it would be worth mentioning Unity has Frame Debugger tool better than the mentioned general-purpose Profiler tool for GPU-related debugging.