Here on gamedev, beginner programmers all-too-often attempt to fix problems with their applications by posting several (or even 100s of) lines of code, and simply state: "Here's some code. It doesn't work. What's wrong?" The apparent expectation of the OP ( Original Post[er] ) is that someone else will quickly spot a coding or logic error, and post the correction. If the OP is very lucky, someone will spot the problem and post information. More often than not, however, that expectation is unfounded, and the topic discussion will carry on for a day or more. More often than not, the OP could have found the problem in minutes, rather than days.
So very few beginners read the Beginner's Forum FAQ, particularly the section "Asking Questions." In that section, with regard to posting, are the statements:
[quote]
Be prepared to answer the question (proactively, ideally) "what have you tried to solve the problem yourself?"
-and-
..try writing a smaller test application that reproduces the problem so that you can post a smaller amount of code for others to search through.[/quote]
The link to "what have you tried?" provides some pertinent advice, with an emphasis on knowing what you're trying to do. I.e., if you don't know what your code should be doing, it's likely you won't find the problem quickly.
The second suggestion in the FAQ mentioned above, writing a smaller test application, may well only increase the difficulty for beginners. If the original problem is not well-understood, creating a new project to attempt to reproduce the error may just cause further confusion.
Sometimes just displaying values while the program is running will provide sufficient information to determine a problem. If your application and/or API permit, values can be displayed by the program itself, or to a console window.
If additional information is needed to locate the problem, another approach to debugging, which I call "Follow The Data," can often result in quick discovery of (at a minimum) a section of code, a few lines of code or even a single line of code that "doesn't work."
This approach requires:
1. The programmer is willing to try to find coding and logic errors on his own, beyond just staring at code and wondering.
2. The programmer understands not only what the code is supposed to do, but how the code is supposed to do it. For beginners, that's easier said than done, and, if the programmer knows (or believes he knows) what the result should be, but is willing to admit he isn't sure how the result is produced, that should be the subject of the topic posted. Once the how is understood, the why-the-code-doesn't-work can be debugged.
3. The programmer has a programming interface ( an IDE ) that supports a run-time "debug" build ( e.g., enabling the D3D11 debug layer,) setting breakpoints, and examining or displaying values while the suspect program is running. If a programmer does not have those capabilities at hand, the "follow-the-data" approach is all but impossible.
Simply stated: "Follow The Data" means
- finding a location in the code where variable values and/or logic produce expected results.
- setting a breakpoint further along the code execution path
- examining values at that breakpoint to determine if they are as expected
- continuing that process until a location in the code is found where values are not as expected.
A problem exists between the previous and the current breakpoint.
Alternately,
- a location is found where the results are incorrect
- breakpoints are set "earlier" in the process
- execution is started over (or continued if the logic supports that)
- values are examined
- the process is continued until a point is found where values are as expected.
A problem exists following the current breakpoint. Continue to "follow the data" as described in the first set of sequence steps.
Displaying Values
==============
Methods for displaying values will differ from IDE-to-IDE, from API-to-API; and will depend on whether the problem occurs frequently or continuously during execution, or only under some conditions that can be determined.
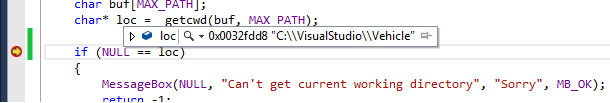
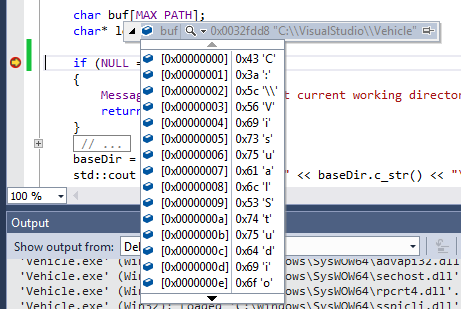
Values can be examined in Visual Studio in a debug build, for instance, by mousing over the variable itself, or by clicking a dropdown list to examine values withiin a structure. In the first image below, the cursor (not shown) is over "loc." In the second, over "buf" and dropdown clicked.
Under more extreme conditions, it may be necessary to dump information on a wholesale basis, either to a debug file or debug output. E.g.,
void DumpMatrix(Matrix& mat){ char num[256]; for (UINT row = 0; row < 4; row++) { sprintf_s(num, "%2.4f %2.4f %2.4f %2.4f\n", mat(row, 0), mat(row, 1), mat(row, 2), mat(row, 3)); OutputDebugString(num); }}Setting breakpoints and examining values can, however, be complicated under certain conditions. An error may be related to a timing issue, and stopping execution at a breakpoint may, in fact, cause an error unrelated to the original problem. Or an error may occur only when a variable is within a small range of values, or even at a single value, and appears to happen only intermittently. Displaying values continuously within a loop to a debugging or console window may result in thousands of messages, either overloading the output or, more subtly, changing timing by the very act of formatting a string and/or sending the information to the debug output.
The programmer may have to use imaginative "traps" to examine or display information. A very simple technique can sometimes be used:
static bool reported = false;if( !reported && some_test_condition_is_true ){ output_some_information_here; reported = true;}A Big Problem: for beginning programmers and experienced coders alike, it is often difficult to decide whether values being examined are correct or not. Variable values are often more difficult to evaluate then a correct directory string as illustrated above. That is, even if the how of a routine is well understood, recognizing correct values may require pad-and-paper drawings, using a calculator to enter variable values as found, googling for a degrees-to-radians converter or a calculator for bitwidth versus depth-value.
Another approach to determining correct values is to produce them within the application itself. That is, calculate values under known conditions (either locally or in a global structure) and compare run-time values with the "good" values, either programmatically or be setting a breakpoint following the run-time calc and comparing good-to-unknown manually.
Using some or all of the techniques above will help you better understand the problem, and be better prepared to answer the question: "What have you done to determine the problem?"