Mandelbrot set generation help
I was going to make a new thread, but seeing as this one appears to have all the right people''s attention, and MDI has what he needs I''ll post here.
I''ve put together a fairly simple program using SDL to display fractal images, with the ability to zoom in also provided. The problem comes when I start to zoom in - as I lose a lot of granularity very quickly and the whole point of a fractal is that it shows detail at any level, which currently mine doesn''t. I was wondering if it was possible that this was related to the precision available in C++ (although I am using double, and long double didn''t seem to make any difference)?
One other possible area I thought the problem could be in was the way I generate the ''c'' values for each pixel. I have a pair of for loops each running to the appropriate axis'' resolution, and then convert each pixel to the correct point on the complex plane using the following procedure:
inline double relocate( double current_in, double min_in, double max_in, double min_out, double max_out )
{
return( ( ( ( current_in - min_in ) / ( max_in - min_in ) ) * ( max_out - min_out ) ) + min_out );
}
Any thoughts welcome

Author
If I understand correctly, you''re having a problem similar to mine. The way to convert to the complex plane coordinates is:
xfactor = (max_real - min_real) / screenwidth;
yfactor = (max_imag - min_imag) / screenheight;
Then the c values are:
c_real = min_real + x * xfactor;
c_imag = min_imag + y * yfactor;
Is that what you were after?
xfactor = (max_real - min_real) / screenwidth;
yfactor = (max_imag - min_imag) / screenheight;
Then the c values are:
c_real = min_real + x * xfactor;
c_imag = min_imag + y * yfactor;
Is that what you were after?
I think either I''m expecting too much from the precision here, or it''s something a bit more subtle.
These two pictures show firstly most of the fractal, and secondly a zoomed-in image where you can see the loss of quality fairly clearly:
Picture 1
Picture 2
These two pictures show firstly most of the fractal, and secondly a zoomed-in image where you can see the loss of quality fairly clearly:
Picture 1
Picture 2

Try more iterations, and play with the way you generate your colors. You're not hitting the mathematical precision limit yet, or the image would start to look really pixellated and blocky.
Typically, I like to set up an arbitrary color scale of, say, 256 colors. Usually, I specify the scale as a curve, with control points to vary the gradations, then evaluate the curve and built a palette. Then, I use a maximum number of iterations of perhaps 512 or 768 for each pixel, take the final iteration count for a pixel, % it by the number of samples in the color scale, then index into the scale to get the final color.
Like this:
Golem
Blender--The Gimp--Python--Lua--SDL
Nethack--Crawl--ADOM--Angband--Dungeondweller
[edited by - VertexNormal on April 16, 2004 3:31:01 PM]
Thanks, I think this is going down the right track. I''m not sure I understand exactly though.
You say you specify the scale as a curve - does that mean more weight is given to the lower iteration values? I''m currently using a logarithm of the number of iterations to generate my colour.
With the control points to vary the gradations, do you mean that, for example, 0-63 would be shades of red, 64-127 green, 128-191 blue and 192-255 yellow or something like that?
quote:Original post by robthebob
Thanks, I think this is going down the right track. I''m not sure I understand exactly though.
You say you specify the scale as a curve - does that mean more weight is given to the lower iteration values? I''m currently using a logarithm of the number of iterations to generate my colour.
I give equal weight to all iteration values, and ensure that the color scale repeats over the range of possible iterations.
quote:
With the control points to vary the gradations, do you mean that, for example, 0-63 would be shades of red, 64-127 green, 128-191 blue and 192-255 yellow or something like that?
Perhaps I confused the issue by talking about a curve, but that''s pretty much the idea. Basically, what I have is a palette. I set the palette up with a smooth color scale; it doesn''t really matter how the scale is generated. It works just as well with 2 control points as with 8, though I think it''s rather boring with only 2 colors. But the end result is simply a 256 color (or however many I want to use) array of RGB colors. I built a simple class that takes a list of control points and a number of samples, and constructs the color palette by interpolating between the control points.
Then to index into the palette, I take the number of iterations of the current pixel and modulus by the number of palette entries in the color scale.
paletteindex = num_iterations % ColorScale.num_palette_entries; Then, I simply use paletteindex to index into the color palette array, retrieve the color, and plot the pixel.
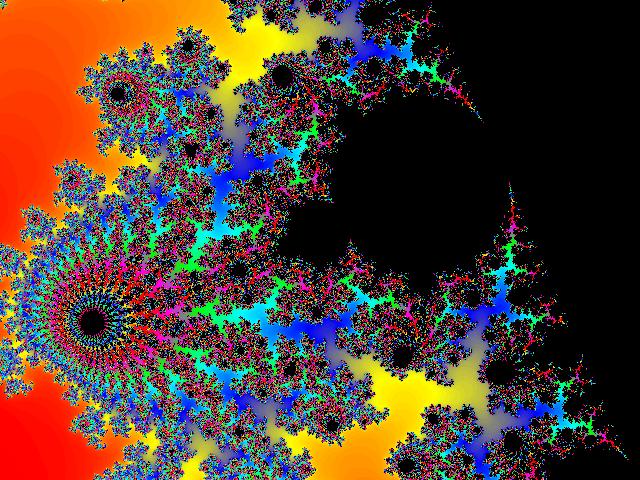
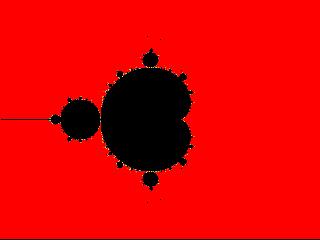
It''s a linear relationship to num_iterations, but if you look at the color distribution, there is plenty of variation concentrated in the "interesting" parts of the fractal. The above and below images were made using 512 iterations, with a color scale 256 colors in length and 6 colors across the scale. With the linear mapping of the modulus of num_iterations, the color variation is concentrated at the "edges", where the interesting patterns occur. At the top level, the fractal isn''t very interesting at all:
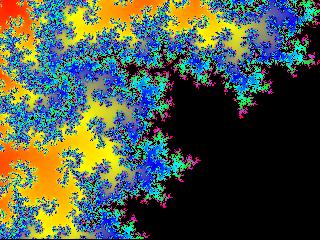
but as you go deeper in:

the color variation starts to get more interesting:
I''ve just found this kind of linear mapping to give very pleasant results. However, even so there are places within the fractal where I just don''t do enough iterations, giving me locations like:
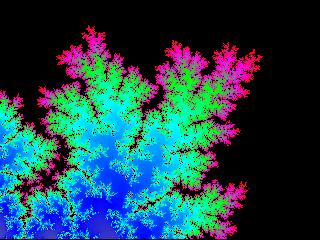
where you can clearly see that zooming in will not reveal fun color variation. More iterations helps, but then it takes a lot longer to compute.
I''m no mathematician by any stretch of the imagination, I just try to use what looks good to me, and this is a method that produces interesting results.
I''m in the process of integrating this kind of palette into my program, and so far it looks to be doing exactly what I need.
Thanks a lot VertexNormal
Thanks a lot VertexNormal
This topic is closed to new replies.
Advertisement
Popular Topics


Advertisement
