Graph reduction (aka terrain analysis)

Started by
7 comments, last by Extrarius 17 years, 10 months ago
Hm... this one is tricky. [grin] Lets go. My goal rigth now seems to be(*) graph reduction. Vertices of such graph represent points that can be considered "narrow passages" in a game map. Actually, centers of such passages, but with some necessary tolerance, that's why many points are redundant, thus the graph is too dense and has to be reduced. Sample: tunnel graph (to be reduced) Is to be reduced to: tunnel graph (reduced) I can see two possible ways of handling this. 1. With some statistical/algebraic mambo-jumbo, distinguish the points that are near the "splits" from those that are far from them (on the "edges" of the final graph). Such points (and all other in the nearest vicinity) will be assumed to belong to a single vertex of the final graph. With such "coloring", we could distinguish "edge" parts from "vertex" parts and proceed with BFS to make up connections between the parts. It's the "mambo-jumbo" stage that is an enigma to me. 2. Something involving "real" graph algorithm, like (this is from the top of my head) Strongly-Connected-Components and the family. But I don't know much about that... How can I proceeed with this? Any ideas appreciated. ~def. ---- (*) Since The Grand Goal, which is terrain analysis, might be possible to acomplish with some other means.
Advertisement
Your picture makes it appear as if you have a collection of triangles (yellow wireframes) to "reduce". One possibility is to rasterize the triangles into an image. Any pixels covered by a triangle are assigned 1. Other pixels are assigned 0. Run the binary image through a skeletonization process that reduces binary blobs to 1-pixel-thick structures plus branch points. The skeleton pixels may be viewed as the vertices of a collection of polylines. You will have lots of these (dependent on how large the binary image is that you use). You can eliminate vertices by some decimation scheme (branch points and endpoints are forced to remain during the decimation).

Your problem also has the look-and-feel of medial axes. You are trying to locate the medial axes of the dark-green region in your image. In fact, you could compute these axes without generating the yellow-wireframe triangles.
Off the top of my head, you might want to check on Voronoi Diagrams. (http://en.wikipedia.org/wiki/Voronoi)
It seems to me like the red blobs are the cell centers and the yellow lines are the edges between them. Hope that helps.


edit: After a bit more thought, this probably wouldn't work all that great for concave regions of red...

[Edited by - WarAmp on June 8, 2006 1:18:12 AM]
Waramp.Before you insult a man, walk a mile in his shoes.That way, when you do insult him, you'll be a mile away, and you'll have his shoes.
Quote:Original post by WarAmp
Off the top of my head, you might want to check on Voronoi Diagrams. (http://en.wikipedia.org/wiki/Voronoi)
It seems to me like the red blobs are the cell centers and the yellow lines are the edges between them. Hope that helps.


edit: After a bit more thought, this probably wouldn't work all that great for concave regions of red...


The "Voronoi diagrams" people are used to involve constructing sets of points that are closest to *single* points. The concept extends to sets of points that are closest to other objects. The medial axis of a polygon is essentially the extension to constructing sets of points closest to the *edges* of the polygons. The medial axis consists of the boundaries separating the closest regions.

So your observation is a good one.
Quote:Original post by deffer
2. Something involving "real" graph algorithm, like (this is from the top of my head) Strongly-Connected-Components and the family. But I don't know much about that...

The tricky part of your problem is that you need to remove vertices, removal of unnecessary edges can be done by algorithms out of an graph algorithms book.

On a second thought replacing strongly-connected-components of the graph with single vertices removes vertices. But probably either too few or too many of them and the algorithm isn't flexible in this aspect, so I would look for something else.
Thanks for all the replies.[smile]

-------

Quote:Original post by Wasting Time
Your picture makes it appear as if you have a collection of triangles (yellow wireframes) to "reduce". One possibility is to rasterize the triangles into an image.
[...]
You can eliminate vertices by some decimation scheme (branch points and endpoints are forced to remain during the decimation).


I got a strong feeling that this would lead me to the same place, that I am right now. Isn't it..?

-------

Ok, this one is for all the suggestions for medial-axes and voronoi-regions. Before I would go down this way, let me point what my (mid-term) goals are. This whole graph is just a temporary stage for dividing a map into regions (not voronoi, something different).

Same example: _______________________________ Is to be divided into something like:
tunnel graph (to be reduced)tunnel graph (final form)

As you can see, in the end, medial-axes per se don't interest me. It's the vertices of the reduced graph that are most important.

-------

Quote:Original post by Trap
Quote:Original post by deffer
2. Something involving "real" graph algorithm, like (this is from the top of my head) Strongly-Connected-Components and the family. But I don't know much about that...

The tricky part of your problem is that you need to remove vertices, removal of unnecessary edges can be done by algorithms out of an graph algorithms book.

On a second thought replacing strongly-connected-components of the graph with single vertices removes vertices. But probably either too few or too many of them and the algorithm isn't flexible in this aspect, so I would look for something else.


Heh, so it's not S-C-C.
Maybe some variation of Minimum-Spanning-Tree?
'Ends' of your graph seem to be represented by vertices with two edges (i.e. the point of a triangle), so that may be where to start.

I don't quite understand what the overall problem is. It may well be possible to go directly from your 'red blobs' to the region bounding lines, but without knowing quite what the regions represent or how they're supposed to relate to each other it's difficult to think along those lines.
Quote:Original post by Bob Janova
'Ends' of your graph seem to be represented by vertices with two edges (i.e. the point of a triangle), so that may be where to start.


Not necessarilly. Sometimes an ending looks like this:
..----      |..-----..----/

Quote:Original post by Bob Janova
I don't quite understand what the overall problem is. It may well be possible to go directly from your 'red blobs' to the region bounding lines, but without knowing quite what the regions represent or how they're supposed to relate to each other it's difficult to think along those lines.


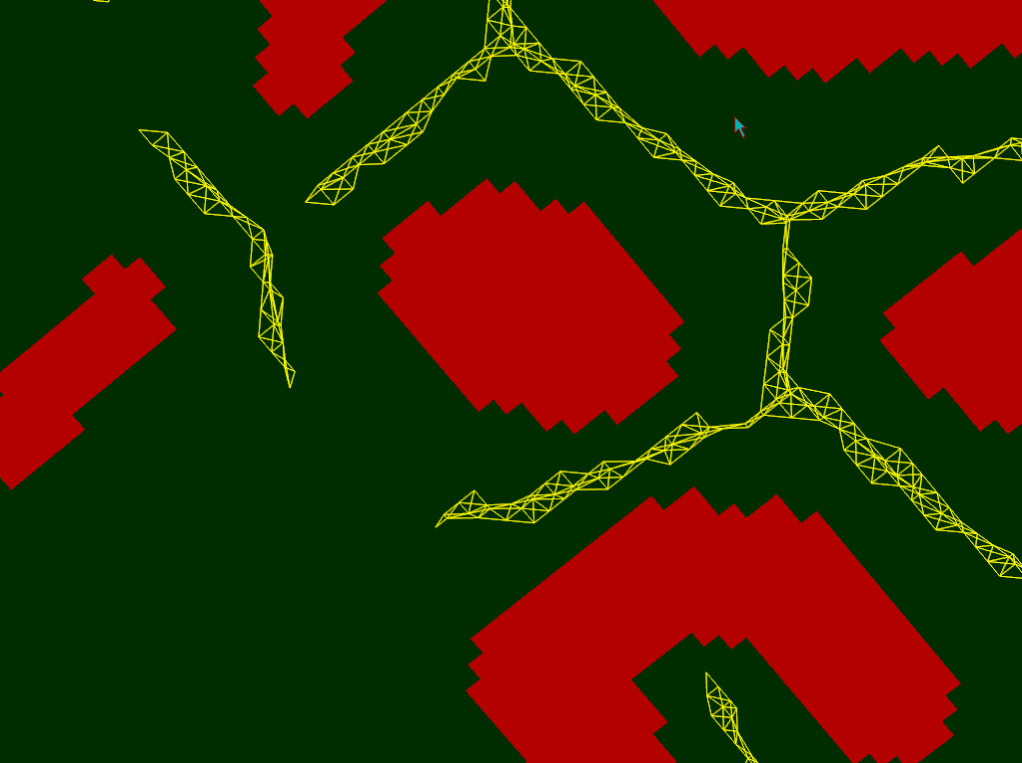
The regions are supposed to represent two kinds of areas:
- narow passages ("tunnels")
- wide open areas
My goal is to decompose terrain description, given as grids and (possibly) other static objects to such areas, so I could improve my AI, from hierarchical pathfinding, to better environment awarness of units.

The endings of the yellow graph represent places where a tunnel is supposedly ending and an open area is starting. The splits of the graph represent places where one tunnel is meeting with another(s).

I can connect points of yellow graph to nearest "walls", to make those divisions, but I have to choose those points wisely, to make as many divisions as necessary, but not more.
I can't help with your immediate problem, but for information on terrain analysis a good place to go is William van der Sterren's website CGF-AI.com. It has several articles and many links that may be of help.
"Walk not the trodden path, for it has borne it's burden." -John, Flying Monk

This topic is closed to new replies.

Advertisement