question about quadratic bezier patch

Started by
13 comments, last by fir 10 years, 5 months ago

when you have quadratiic bezier curve you got three points say P0, P1, P2

P0 and P2 are the edges of the curve but P1 do not lay on the curve but

lines P0-P1 and P1-P2 are making some kind of "roof" for that bezier curve

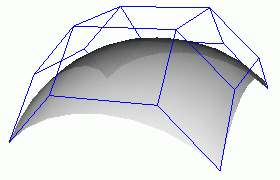
when i got bezier path i understand that I got 9 control points, I can imagine

4 curves making the 4 edges ot patch - the corresponding pairs of points on

those edges i could use to make the inner parts of the this patch but I also

needthe inner 'roof' points for eachof the pair

I got 5 roof points (4 for edges and 1 central points) Is this true that the

'roof points' I need as a control points would be laying on the lines which are

make from those 5 roof points?

check out for drawings on

http://www.gamedev.net/page/resources/_/technical/math-and-physics/bezier-patches-r1584

I hope it is managable to understand what I am asking about.. I would like

to imagine a process of quadratic bezier path creation - to make this I belive

I need infinity of pairs of edge points (edge points I can get from simple

bezier curves of edges) and also inifinity of 'roof' contraol points - and I am

not sure how to make, imagine where lays this control points

(I also assume that infinity of bezier curves made in u direction and inifinity

of bezier curves made in v direction will cover exactly the same points - but this

is probably true - is this?)

thanx for answer

Advertisement

With Bezier curves, the only control points that are guaranteed to be on the curve are the endpoints. Bezier surfaces are like Bezier curves, where the corner control points of the Bezier patch are guaranteed to be on the surface. In a biquadratic Bezier surface patch, you'll have 9 control points, but every point but the center one will control the edges of the Bezier patch. In the example below, the surface is a bicubic patch, but as you can see, the edges are controlled by all the control points at the edges of the patch, not just the corners. The control points at the corners are on the surface, but none of the others are.

surf2.gif

I don't quite understand what you mean with all your talk about infinities. It might be better to explain what you're using the Bezier patch information for so others here can help you devise a good strategy for solving your problem.

Allright I made some drawing

[attachment=18812:quadtaticbezierpatch.png]

This has nine control points.

Lest assume that I do not want to draw a filled patch but I want to

draw a 'grid' of beziers (say 100 horizontal (u) x 100 verticall (v))

To draw each bezier I need three points, I can easily draw 4 edges

because I got points needed to do that,

but then I need to draw inner beziers (i draw one in red), and i got

only two points (they are laying on prewiously drawed edges)

(I think i can use 0.7 v distance on both edges to get the points)

MY question is about the third red point - from where I could get it?

Is this point laying on the line (line segment) between the center

control point (one of the 9 oryginal) and one of the center of the farest edge ? So i just could get 0.7 distence on both segments and get this

point - then just draw this inner red curve?)

Or this is incorrect? and this is not that point?

The control points of the Bézier curve corresponding to a fix u or v coordinate can obtained by evaluating the three Bézier curves along the other direction at the fixed u or v coordinate. For example, let suppose you want to compute the Bézier curve at some fixed u. Your three control points are thus \sum_{i=0}^2 P_{i,0} B_i(u), \sum_{i=0}^2 P_{i,1} B_i(u), \sum_{i=0}^2 P_{i,2} B_i(u). The formulae for the other direction are analogous.

EDIT: Corrected some typos in formulae.

The control points of the Bézier curve corresponding to a fix u or v coordinate can obtained by evaluating the three Bézier curves along the other direction at the fixed u or v coordinate. For example, let suppose you want to compute the Bézier curve at some fixed u. Your three control points are thus \sum_{i=0}^3 P_{i,0} B_i(u), \sum_{i=0}^3 P_{i,2} B_i(u), \sum_{i=0}^3 P_{i,3} B_i(u). The formulae for the other direction are analogous.

I did not understand it

\sum_{i=0}^3 P_{i,0} B_i(u)

??

Do you say about evaluating formula fot some constant v

(In my drawing it would be about v=0.7) ?

If i have some equation Q(u,v) and evaluate it for Q(u,0.7)

I think I will get the resulting points of curve, but the control

point I am searching for is not lying on that curve

or you know some formula for this control points but the

one you wrote Is not managable to me to read

The most basic answer I need is if this

red control point will be laying on the line segment (in distance

0.7 on both ti is 0.2 between the centric control point and

the back control point on my drawing) or not

?

(If not how to get it?)

That's latex code. It look like it is less readable than I assumed. I don't know how to write equations in this forum anymore (the eqn tag does not seem to work and I can't upload images from 3rd party services).

If you fix one of the two coordinates (for example v = 0.7 as in your example), the corresponding basis polynomials B_j(v) becomes constants. You can thus sum the terms P_ij B_j(v) for 0 <= j <= 2 to obtains the control points for a quadratic curve depending only on the parameter u.

Apatriarca's right on. Each point on the Bezier surface corresponds to a (u,v) parameter. You can get what's called an isoparametric curve by holding one of the parameters constant. In your example, you're holding v = 0.7, which does yield a curve like you've drawn. The control points of that curve can be found by evaluating the Bezier curves in that direction at v = 0.7. I've modified your drawing to show what I mean:

[attachment=18818:Untitled.png]

The blue curve is just the Bezier curve defined by the 3 middle control points. The point on that curve at v = 0.7 is the middle control point for the orange curve, just like the end control points for the orange curve are the surface edge Beziers evaluated at v = 0.7. Mathematically, the Bezier surface is defined like this:

\[ S(u,v) = \sum_{j=0}^n \sum_{i=0}^m P_{ij} B_{i}^m(u) B_j^n(v) \]

where m and n are the degrees in the u and v directions, respectively, and \( B_i^n(t) = \binom{n}{i} (1-t)^{n-i}t^i \). If you hold a parameter constant (in this case, we'll hold \( u = u_0\)), and group the inside terms like so:

\[ S(u,v) = \sum_{j=0}^n \left [ \sum_{i=0}^m P_{ij} B_{i}^m(u_0) \right ] B_j^n(v) = \sum_{j=0}^n Q_j B_j^n(v) \]
you can see that \( Q_j \) are control points for an isoparametric curve at \( u = u_0 \). The above picture shows how this works graphically. I hope that helps to back up what apatriarca was saying.
@apatriarca: I think the forums use MathJax, like the articles do. You can use \ [ and \ ] to enable LaTeX and \ ( and \ ) for inline typesetting. I had to add spaces between the slashes and brackets above to stop MathJax from rendering them as LaTeX.

Apatriarca's right on. Each point on the Bezier surface corresponds to a (u,v) parameter. You can get what's called an isoparametric curve by holding one of the parameters constant. In your example, you're holding v = 0.7, which does yield a curve like you've drawn. The control points of that curve can be found by evaluating the Bezier curves in that direction at v = 0.7. I've modified your drawing to show what I mean:

attachicon.gifUntitled.png

The blue curve is just the Bezier curve defined by the 3 middle control points. The point on that curve at v = 0.7 is the middle control point for the orange curve, just like the end control points for the orange curve are the surface edge Beziers evaluated at v = 0.7. Mathematically, the Bezier surface is defined like this:

\[ S(u,v) = \sum_{j=0}^n \sum_{i=0}^m P_{ij} B_{i}^m(u) B_j^n(v) \]

where m and n are the degrees in the u and v directions, respectively, and \( B_i^n(t) = \binom{n}{i} (1-t)^{n-i}t^i \). If you hold a parameter constant (in this case, we'll hold \( u = u_0\)), and group the inside terms like so:

\[ S(u,v) = \sum_{j=0}^n \left [ \sum_{i=0}^m P_{ij} B_{i}^m(u_0) \right ] B_j^n(v) = \sum_{j=0}^n Q_j B_j^n(v) \]
you can see that \( Q_j \) are control points for an isoparametric curve at \( u = u_0 \). The above picture shows how this works graphically. I hope that helps to back up what apatriarca was saying.
@apatriarca: I think the forums use MathJax, like the articles do. You can use \ [ and \ ] to enable LaTeX and \ ( and \ ) for inline typesetting. I had to add spaces between the slashes and brackets above to stop MathJax from rendering them as LaTeX.

i did not se equations (maybe it would be ok to draw it somewhere screenshot cut and add here as an attachement - image - it is nice easy to add- or just give the link to some page in wiki or somewhere - my knowledge about bezier patches comes by now only from gamedev articles )

I do not understand the answers - the trouble in my understanding the thing is this that this blue curve defines

some points but those are the points that my red curve should intersect/contain - but not the control ('roof') point - I need the control point not the containing point

(at least I would like to know if this point lies on the line segment, as I was already talking about it)

[there is probably some formula for drawing quadratic bezier

leading through three containing points - not two containing and one control - but I would like to know where is this control point too ]

Let P(i, j) be the control points of the quadratic Bézier surface patches, C(P0, P1, P2, t) represents a quadratic Bézier curve with control points P0, P1 and P2 with parameter t and S(u, v) the quadratic Bézier surface patch equation. We are trying to explains to you that

S(u, 0.7) = C( C(P(0,0), P(0, 1), P(0,2), 0.7) , C(P(1,0), P(1, 1), P(1,2), 0.7) , C(P(2,0), P(2, 1), P(2,2), 0.7) , u).

alright - but let see :

C(P(0,0), P(0, 1), P(0,2), v )

is a bezier curve containing points P(0,0) and P(0,2)

not containing point P(0,1)

but when you wrote

S(u, 0.7) = C(

C(P(0,0), P(0, 1), P(0,2), 0.7) ,

C(P(1,0), P(1, 1), P(1,2), 0.7) ,

C(P(2,0), P(2, 1), P(2,2), 0.7) , u).

all this three points are belonging to the result curve

C(P(1,0), P(1, 1), P(1,2), 0.7) is containing point, (it lays on the surface) not control 'roof' point as a P(0,1) is

when you give three points say a,b,c to C(a,b,c) here b is

only control point C will not lead through it - result of C(a,b,c)

belongs to the surface, but b should not

[even on the cadjunkie drawing you see

the difference, check the middle edge green dots - they

do not lay on the curve - check the middle red dot -

it is laying on the curve [this is probably wrong,]]

This topic is closed to new replies.

Advertisement