Profiling results, GPU or CPU bound?

Started by
7 comments, last by cozzie 9 years, 8 months ago

Hi,

After some refactoring and adding new features in my engine, I've been doing some profiling.

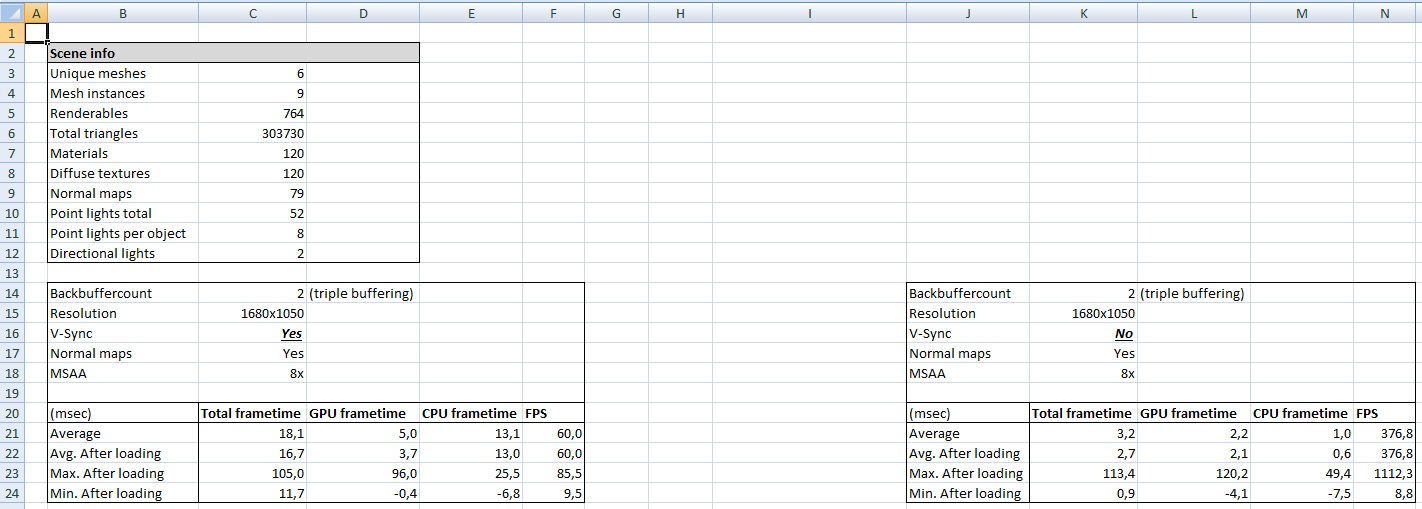
I did it on both a simple scene and a more complex scene.

You can see all results here:

http://www.sierracosworth.nl/gamedev/2014-07-29_profiling/

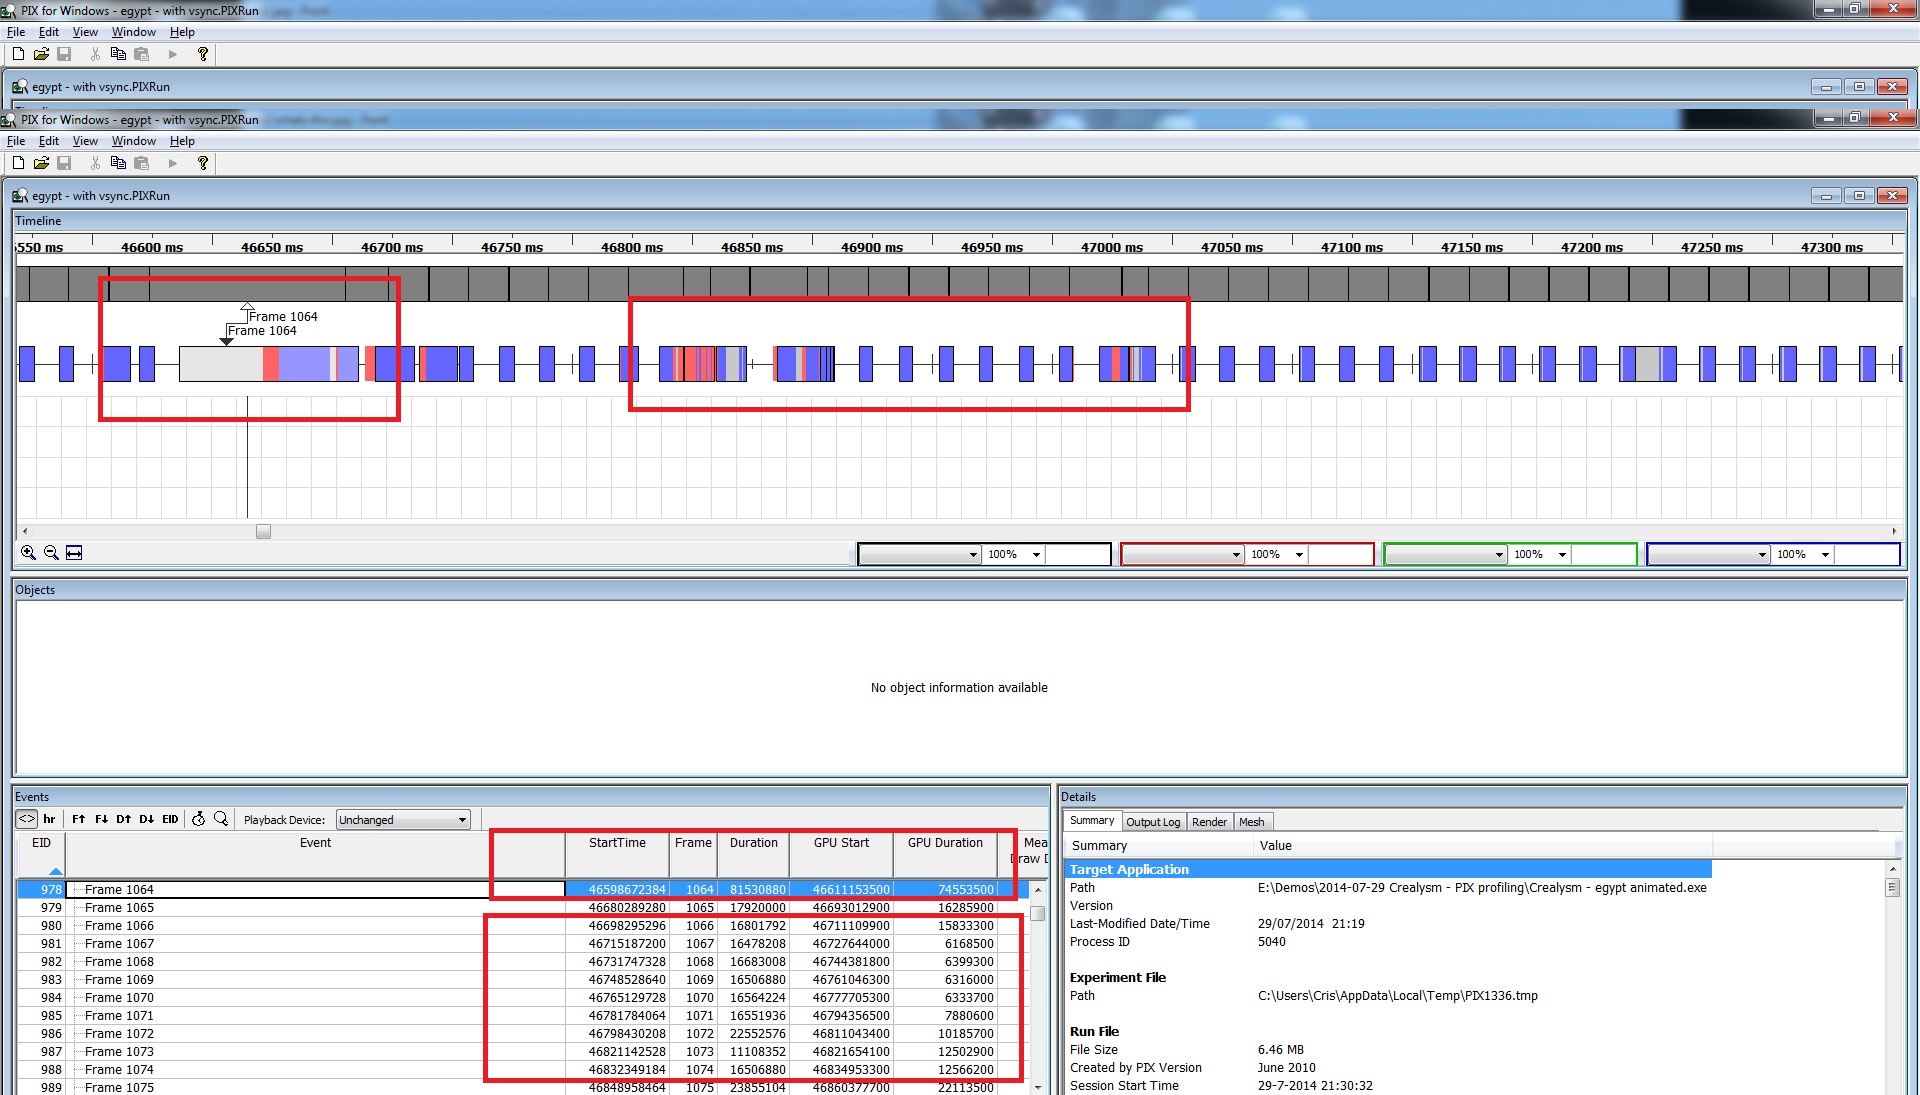
It's actually quite fun to check your code against one full frame and all 'underlying' d3d calls that are done.

But now you think, what's the question?

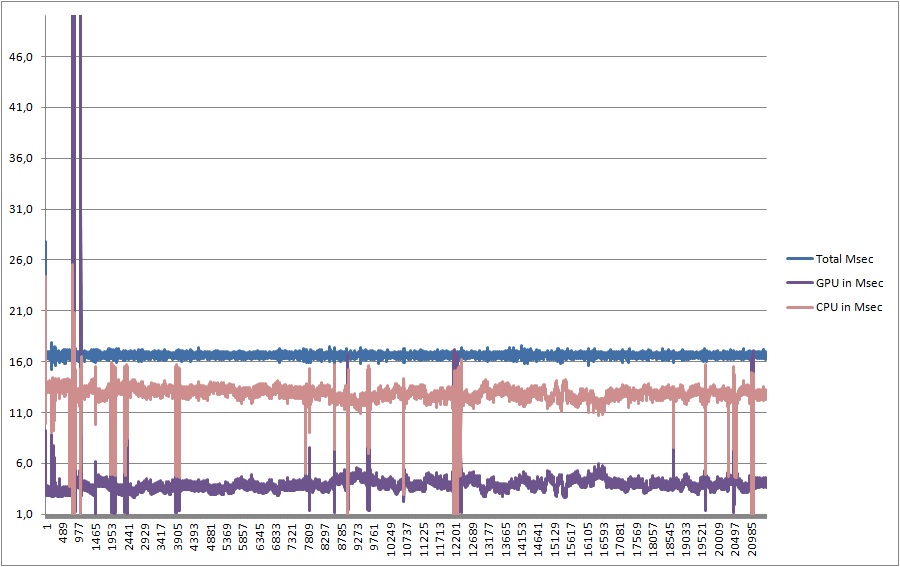
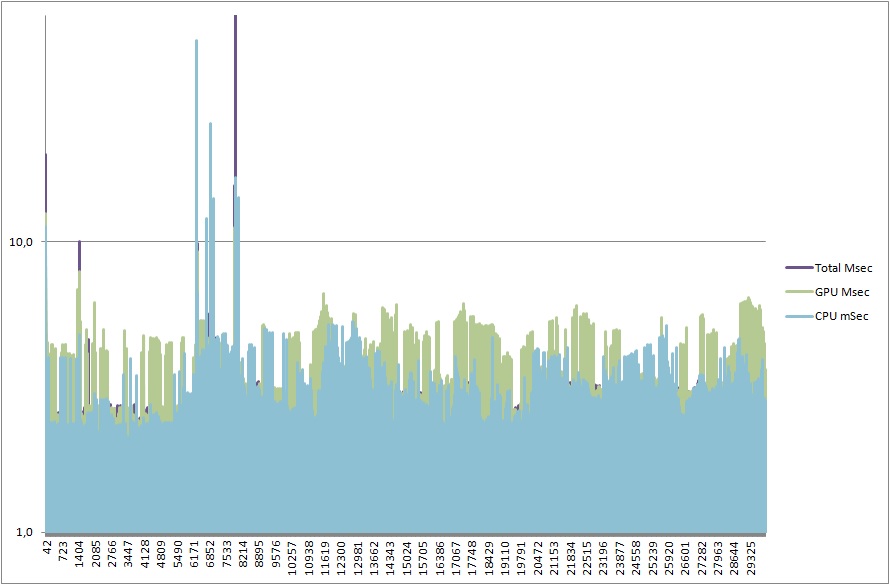
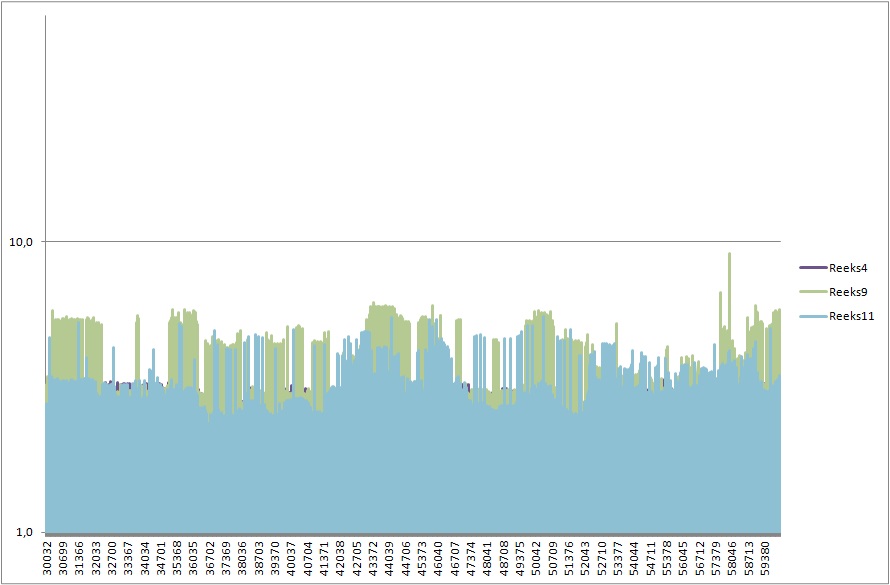
In the screenshot below you'll see an example of 'peaks' I'm getting (Stutter) in total frametime. Now I'm trying to find out it they are cased by either too much work for the GPU (CPU is waiting) or is the GPU waiting because the CPU isn't delivering enough. My first thought would be that the GPU is too busy to handle everything the CPU delivers.

What are your thoughts?

complexer_scene_gpu-cpu3-whats-this.jpg

Crealysm game & engine development: http://www.crealysm.com

Looking for a passionate, disciplined and structured producer? PM me

Advertisement

The standard way to work out what the bottleneck is is to give the GPU less work to do, and see if it goes any faster. If it does then you're not completely CPU bound. You need to do this while still making the same set of draw calls. There are various ways to do this, including:

- Reduce the screen resolution or render target size.

- Set a tiny scissor rectangle.

- Replace pixel / vertex shaders with simple ones.

Having said that, if you're looking at single frame spikes with D3D a common cause is using something (shader / texture / vertex buffer / etc.) for the first time. This is because D3D drivers are generally lazy and only fully initialize things on first use. While this saves on doing work for things you never use, in most cases it's really unhelpful. The workaround is to do a bunch of off screen draw calls on the loading screen that make use of every texture and shader. That means you don't have to wait for the driver to, for example, upload a bunch of textures to video RAM when the end of level boss appears.

Hi adam, thanks.

I've played around a bit and did a new test without normal mapping (79 out of 134 materials), now the peaks we're all gone.

After this I also was told that the number of backbuffer (in my case 1, so double buffering), could be the issue. So I upped that to 2 (triple buffering). Now I get a lot less peaks.

So I assume that the GPU was waiting for new stuff till V-sync time passed, now with an extra buffer there's enough to render.

What do you think?

Crealysm game & engine development: http://www.crealysm.com

Looking for a passionate, disciplined and structured producer? PM me

In general profiling with vsync enabled isn't very useful, because the delays waiting for the vsync tend to hide the real performance. I'd recommend doing all profiling with vsync off.

Enabling triple buffering can hide even more performance issues than vsync alone, but it will also generally give a better experience than double buffering with vsync when the game is running slower than the refresh rate.

Also note that you want to profile an optimized build, which wasn't started with the debugger attached (starting with the debugger attached puts the Windows heap into a relatively slow debug mode).

What's the performance like with vsync off?


This is because D3D drivers are generally lazy and only fully initialize things on first use.

As a side note: other drivers do this as well. Current AMD OpenCL sure does.

Previously "Krohm"

Thanks both, I've done some serious profiling after reading your remarks.

For the number of backbuffers I've sticked with 2 (triple buffering), which I will use in the end anyway.

I did 2 new runs and measured a lot of things and also created some graphs.

The runs were done with and without v-sync enabled.

You will find all details below, please let me know your thoughts.

Overall summary:

2014-07-31_profiling%20summary.jpg

Graph on the run with V-sync:

2014-07-31_run2%20-%201680x1050%20vsync%

And 2 graphs on the run without V-sync (splitted into 2x 30.000 frames):

2014-07-31_run1%20-%201680x1050%20no-vsy

2014-07-31_run1%20-%201680x1050%20no-vsy

Crealysm game & engine development: http://www.crealysm.com

Looking for a passionate, disciplined and structured producer? PM me

Any thoughts, adam, krohm, others?

Crealysm game & engine development: http://www.crealysm.com

Looking for a passionate, disciplined and structured producer? PM me

With vsync off it looks like your game is generally running fast enough. There's a few spikes where frames are getting close to 16ms which could be explained by my first post. Other than that it's running at about 8ms / frame.

I don't trust those CPU performance numbers. The vsync off numbers should have roughly the same CPU usage as with vsync on. My guess is that you're measuring the CPU time spent idle waiting for the GPU in those numbers. That generally happens in the Present() call.

With vsync off you have a couple of spikes, which are close to 3 times the normal frame time (~50ms). One possible explanation is that somehow the CPU and GPU were forced to synchronize on those frames. D3D buffers up to 3 frames worth of GPU commands when it's GPU bound, and forcing a synchronization will flush that queue (so the CPU gets blocked for 3 GPU frames). Forcing synchronization generally happens when you lock something that is in use by the GPU (vertex buffer / texture / etc). See http://msdn.microsoft.com/en-gb/library/windows/desktop/bb205132%28v=vs.85%29.aspx#Accessing for a D3D10 based explanation of that.

In addition allowing the GPU to get three frames ahead can give you extra lag that you may not want. You can use queries to prevent it getting so far ahead - you want two of them where you issue one and wait for the other on every frame, and then swap over. Note that you do want to allow it to get one frame ahead or you throw away lots of performance because that allows the GPU and CPU to work in parallel (and for SLI systems you should allow it to get two frames ahead). For a quick test Nvidia drivers also have a setting to control it called "maximum pre-rendered frames".

Hi.

Thanks, maybe I can find a way to figure out what's exactly happening at those 'peak frames' with v-sync off.

I didn't find a way yet to do a full run in PIX including both CPU/GPU times and all data per frame, that's probably not possible because of the amount of data. Maybe I can set a trigger action that acts like 'save frame date' when frametime is > x.

Regarding the CPU times with V-sync on, you're absolutely right. What I did to calculate them is total frame time - GPU time, so in that case CPU times include 'waiting time'.

I'm actually not locking vertex/ index buffers during rendering (only when loading), maybe some D3D calls I use lock the buffer or texture under water, like setstreamsource or settexture. I'll measure a full frame with all d3d calls and see if there are any lock calls.

Crealysm game & engine development: http://www.crealysm.com

Looking for a passionate, disciplined and structured producer? PM me

This topic is closed to new replies.

Advertisement