Low framerate during first seconds

Started by
7 comments, last by PLCrashy 6 years, 7 months ago

Hi gamedev !

I'm facing a really strange performance issue occurring during the first seconds of my app.
When launching the app, three scenarios:

  • Some erratic frames at the very beginning, then 70+fps.
  • Some erratic frames at the very beginning, then ~12fps, then, after a few seconds, BAM, 70+fps.
  • Some erratic frames at the very beginning, then stuck at ~12fps.


Camera is static, so is the scene.

I used nsight to try figure out what's happening, especially in case 2 where I can see what are the differences.
When it's rendering at ~12fps, some glDrawRangeElementsBaseVertex/glDrawArrays calls takes a lot of time, some SwapBuffers calls too, and after switching to "cruise speed", those calls are taking a more moderate amount of time:

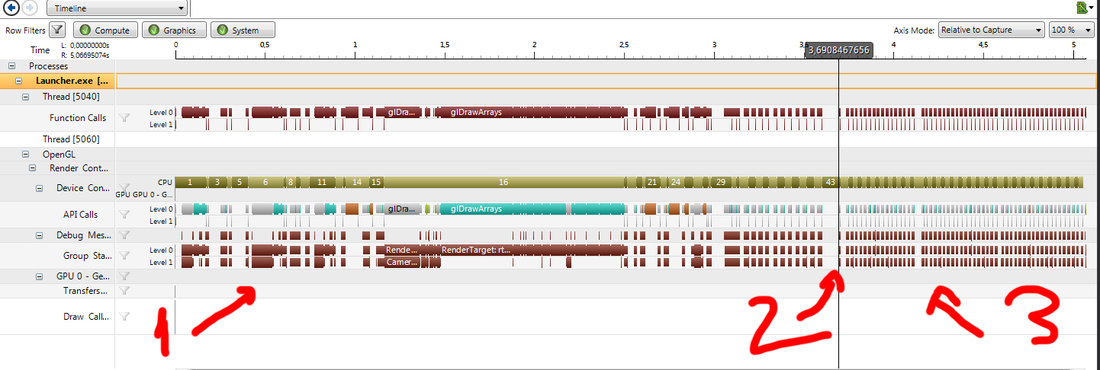
Here is a capture of a nsight session timeline:


timeline.thumb.jpg.446f9edf22d15f37e50044c67d519cbe.jpg

1->erratic framerate at the beginning

2->KICKSTART !

3->stable and high framerate

Memory usage is the same in all cases.
CPU Usage is a bit higher when stuck at ~12fps, but nothing remarkable.

My scene is really simple (only a few cubes), but I use a lot of post process (SSAO, SSR). Reducing the framebuffer size to a smaller one doesn't change anything (although top speed is faster).
I also tried to disable all my post process, issue is still there but case 1 is the most common.

it is really similar to what's described in this post, although I'm not using vsync at all (double checked code, and also forced vsync off with the nvidia control panel) nor SDL.
https://www.opengl.org/discussion_bo...-slow-on-start

I also tried to put some glFlush()/glFinish() here and there in my code, without success.

A few specifications:
OS: Windows 7
CPU: Core I7 6700
GPU: Nvidia 560Ti
Drivers: 385.41
I'm stuck with this issue for months now, it's driving me crazysick.gif

Thanks for any help/advice/question/test to make

Advertisement

Throwing a dart in the dark here...

When you launch your app, everything is cold. Driver has to setup who knows what for your application in the background, compile your shaders, pass stuff to the GPU, etc. Once all of this stabilizes (say, you've used all your shaders at least once for actual drawing), everything runs as expected.

Drivers do a lot of lazy loading, specially for OpenGL where there are tons of paths to do the same thing and they might require slightly different things. You might ask the driver to compile a shader, and bind a bunch of state, but the driver might only actually do that work when you actually draw with any of them set, until that happens, the driver can just "pretend" it did what you told it to do. It saves up work if you say, change the raster state 3 or 4 times until you actually draw with it. Driver makers prefer to assume you're stupid rather than taking the backlash of XYZ big game that doesn't works as fast as the competition.

Also if you're using any kind of "managed language" (something that runs on top of the CLR or a JVM for instance), those have to do a lot of setup work too, usually concurrently with your application (say, HotSpot, a JVM, can run your code in interpreted mode, while it is compiling it at the same time, then later replace it with the compiled code when it finishes).

This is also true of native languages to a lesser extent for different reasons, big exe/dll/so/dylib/etc might take a while to load and the important bits might take a while until  they hit the CPU caches.

"I AM ZE EMPRAH OPENGL 3.3 THE CORE, I DEMAND FROM THEE ZE SHADERZ AND MATRIXEZ"

My journals: dustArtemis ECS framework and Making a Terrain Generator

Thanks for the answer:)

I know driver must be busy after resource loading, and could accept having some long frames at start, but in this case, 33% of time I've got a game completely unplayable.

I also made tests removing all of my threads, just to see if it was a concurrency issue, and unfortunately it didn't change anything.

Everything is in c++, no managed code.

I may add that if I run the exe by doing "Nsight/Start Graphics Debugging", everything is ok, of course I have some hiccups at start but then, game runs smooth every time.


Ah right, I misunderstood the problem. Just in case, hows GPU memory usage? Most 560 have 1Gb, you might be threading in a line where sometimes you're running out of GPU memory and sometimes you don't, for whatever reason.

You can check it in a nice graph with something like MSI Afterburner or GPU-Z.

Check system memory too just in case.

"I AM ZE EMPRAH OPENGL 3.3 THE CORE, I DEMAND FROM THEE ZE SHADERZ AND MATRIXEZ"

My journals: dustArtemis ECS framework and Making a Terrain Generator

Alright here are the results of my quick benchmarks made using GPU-Z to track gpu memory.

During loading and the first erratic frames, gpu memory is full (1000MB).

After that, it falls down to around 800 MB, framerate is stable but low.

And if after a few seconds framerate increases, GPU memory goes to around 950MB, if not, it stays at 800MB/low fps forever.

So there is a real correlation between both memory usage & performance.

I tried changing the format of the few FLOAT16 RGBA  FBOs I use to RGBA8 in order to reduce size, but it didn't change anything to memory usage, which is strange.

System memory shows the same relationship between memory & framerate.

systemmemory.jpg.33a612cab7207080ff0e870e6bae7005.jpg

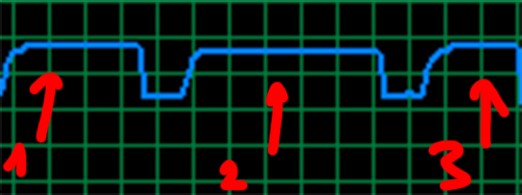
1: first run, app runs fine at 70 fps

2: second run, app is stuck at 12 fps.

3: third run, same as 1

As you can see, the difference is small (100 MB) but noticeable.

Thanks for trying to help me :)

Are you running in fullscreen at 4k or something? Say, on my Windows 7 desktop I get around 100Mb of GPU memory used constantly, the rest is available. So if you have anything else running that hogs VRAM, close it (games, videos, chrome, whatever). See how much your application is actually taking. Try running it in a 800x600 window.

"I AM ZE EMPRAH OPENGL 3.3 THE CORE, I DEMAND FROM THEE ZE SHADERZ AND MATRIXEZ"

My journals: dustArtemis ECS framework and Making a Terrain Generator

Running in 720p, and yes, I find this crazy to have so much vram used, should have tracked that before. I use only a few small textures for the moment, no reason to have so much memory used.

Thanks for your help, I'll check what's wront and post the solution here :)

Alright, here are the various causes :)

  1. I had some extra large (8k) textures I used to generate small sdf font textures, but never removed them after sdf generation.
  2. My shadow maps are packed into a single big GL_R32F atlas, and the depth buffer of this FBO is as large as the atlas, so it's a huge amount of memory. Correct me if I'm wrong, but I think if I use GL_DEPTH_COMPONENT32F as a format I'll reduce memory used by 2.

Thanks again for pointing me in the right direction.

This topic is closed to new replies.

Advertisement