White Chart in Mecanim Transition Inspector Window

Started by
1 comment, last by frob 6 years, 3 months ago

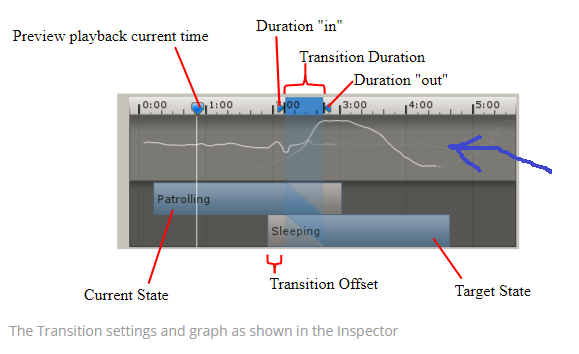
What does the white chart represent? How is it being calculated? 
Can I use it to set the other parameters (offset + duration) in order to achieve smoother cross-fade results?

Apologies if that's not the right forum to ask Unity questions.. I love gamedev.com and wanted to ask the question in here.
 

upload_2018-1-4_7-30-21.png

Advertisement

I believe each white line represents the change due to each animation clip.  I'm not sure how they come up with the squiggles, probably the sum of the motions.

Each white line fades in/out based on the transition curve. It can be useful to visualize and avoid an abrupt transition between animations, or to identify when an animation is moving back to idle or stable state. The person editing the transition can use the visualization to align the steady portions of the animations or otherwise help provide a more continuous transition.

This topic is closed to new replies.

Advertisement