1 hour ago, JoeJ said:
What you want is AFAIK impossible, you can't debug GPU code like CPU code. All you can do is implementing your own logging, e.g. use a buffer entirely for debugging reasons, store numbers to it from shader, print numbers from GPU.
Some APIs (/ GPUs?) support true printf style outputs from shaders, but i never used that so don't know which.
OpenCL with Intel SDK allows stepping into code like you expect, but only if it runs on CPU and you still need to specify workgroup and thread index, so still a bit annoying to use.
After some time i get comfortable with using the debug buffer and rarely mess a real debugger (But if so - yep, it hurts )
Thank you so much and sorry for my emotional post; the GPU can feel like a black box and be very intimidating. Anyway, here's what I learned from a day of extreme pain and trial and error, if anyone's interested -
1. Hit alt + F5 or click Debug > Graphics > Start Debugging.
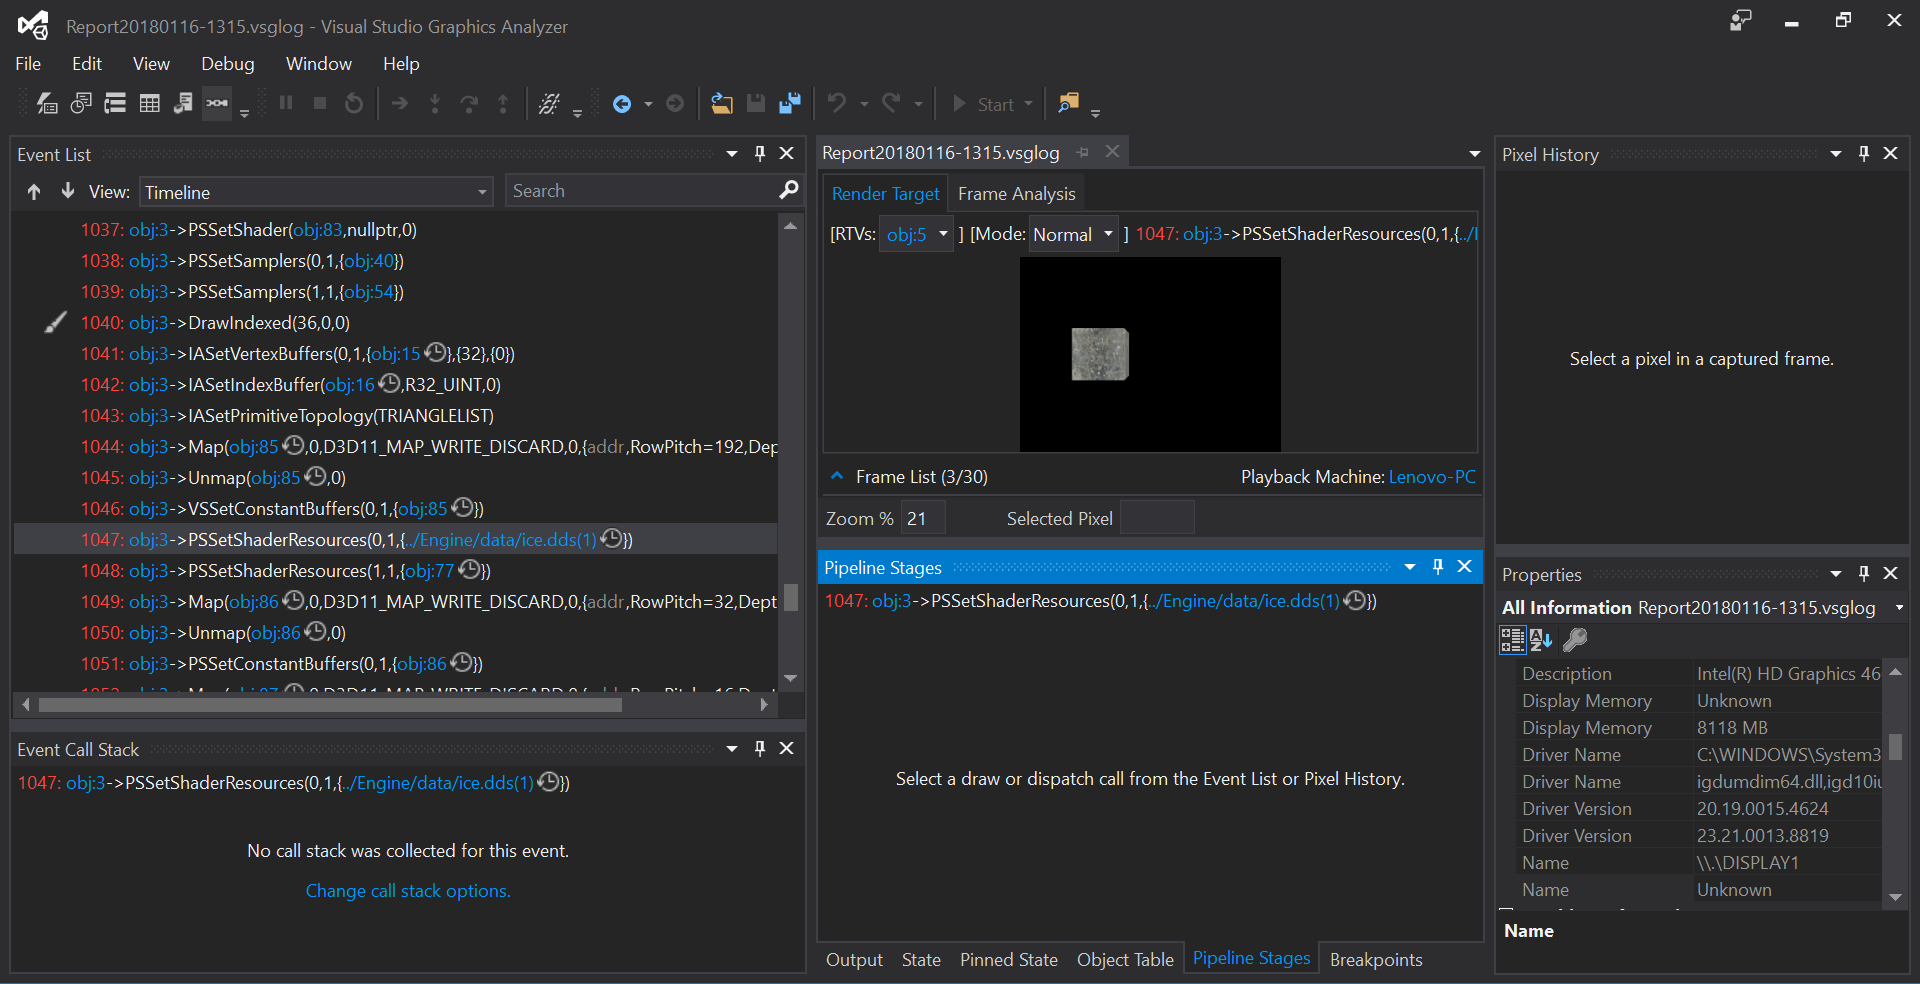
2. While it's running, tab out of your program window and click the "capture frame" button.
3. Double click on the thumbnail that appears of the frame capture to open the Graphics Debugger.
4. On the lefthand side, there is a window called Event List. If you click on the events in there one by one, you can see previews of how the frame looks like in the "Report..." window.
5. Click on a pixel inside the report window (assuming it shows some actual objects; if its all black then you're shit out of luck), and another window called Pixel History should appear on the right.
6. In the righthand window (Pixel History), expand DrawIndexed > Triangle > and then click the green triangle next to Vertex or Pixel Shader and THEN it will finally open the hlsl for that shader (you can only see which shader it actually was by clicking on it), and you can step thru it with F10.
So as far as I understand, there's no point in breaking inside the hlsl, because it doesnt debug it in realtime anyway; the best you can do is inside the capture you have made, step thru it w F10 line by line.
*If anyone knows how to set a breakpoint in the hlsl file that will actually be hit when it runs instead of only using F10, please let me know. Another thing I find annoying is that you cant just search for the name of the hlsl shader file and go to it; you have to click on every single event in the event window until you're lucky enough to see a primitive in the report window, then click on that and follow the above steps to get to the actual hlsl file. So if someone knows how to just go straight to the hlsl file and step through it in the graphics debugger, that would also be a huge help.
Anyway, thought I would share the above slightly more human readable guide to limited use of the Gfx debugger for those traveling the same hellish path I have taken.