Optimizing OpenGL rendering

Started by
20 comments, last by congard 4 years, 10 months ago

Hello! I ran into a poor performance problem when rendering to OpenGL using Assimp. The scene has 266327 triangles. At the same time ~215k is a model of chess. I do not think that the problem is in shaders, because:

128x128 window: 44 (43.7657) FPS, 22.849 ms

256x256 window: 42 (40.9563) FPS, 24.4162 ms

512x512 window: 35 (34.8007) FPS, 28.7351 ms

1024x1024 window: 22 (21.084) FPS, 47.4293 ms

But if I don’t draw chess, then in the window 1366x763: 55 (54.8424) FPS, 18.2341 ms

Also, changing the resolution of the shadow map does not greatly affect the FPS.

There are 2 point light sources on stage, with FPS loss when drawing this model for each of the passes ~10 FPS (from 23 to 55). Ie, there is no difference where I draw this model: in the depth map or in the "color texture". Losses ~ are the same. I load the model with the following parameters: aiProcess_Triangulate | aiProcess_CalcTangentSpace | aiProcess_JoinIdenticalVertices

And render as follows:


pointer(cs.inPosition, 3, model.shape->meshes[i].getVerticesBuffer());
pointer(cs.inNormal, 3, model.shape->meshes[i].getNormalsBuffer());
pointer(cs.inTangent, 3, model.shape->meshes[i].getTangentsBuffer());
pointer(cs.inBitangent, 3, model.shape->meshes[i].getBitangentsBuffer());
pointer(cs.inTexCoord, 2, model.shape->meshes[i].getTexCoordsBuffer());

if (model.shape->bonesPerVertex != 0) {
    pointer(cs.inBoneWeights, 4, model.shape->meshes[i].getBoneWeightsBuffer());
    pointerui(cs.inBoneIds, 4, model.shape->meshes[i].getBoneIdsBuffer());
}

modelMatrix = &model.transformation;
updateMatrices();

glBindBuffer(GL_ELEMENT_ARRAY_BUFFER, model.shape->meshes[i].getIndicesBuffer());
glDrawElements(GL_TRIANGLES, model.shape->meshes[i].indices.size(), GL_UNSIGNED_INT, nullptr);

Here is the scene itself:

1.thumb.png.2c4dc3ee6336f76174282e76179cfc0a.png

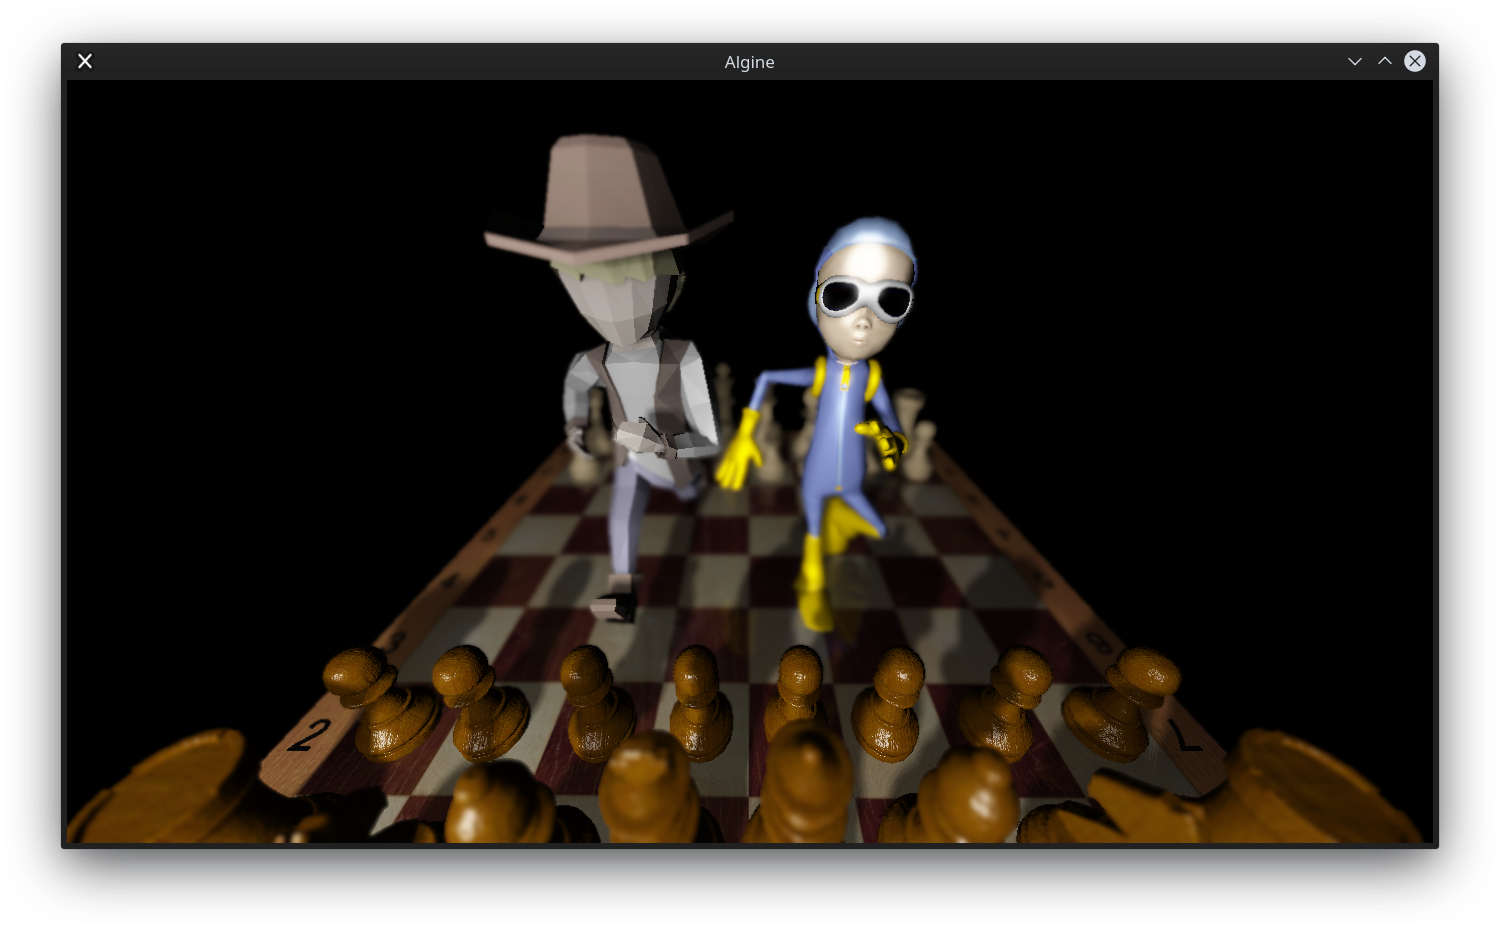
I will be grateful for the help!

Advertisement

Small edit: chess triangles are 298084, scene triangles are 367727

pointer function:


inline void pointer(GLint location, int count, GLuint buffer) {
	glBindBuffer(GL_ARRAY_BUFFER, buffer);
	glVertexAttribPointer(
		location, // attribute location
		count, // count (1, 2, 3 or 4)
		GL_FLOAT, // type
		GL_FALSE, // is normalized?
		0, // step
		nullptr // offset
	);
}

inline void pointerui(GLint location, int count, GLuint buffer) {
	glBindBuffer(GL_ARRAY_BUFFER, buffer);
	glVertexAttribIPointer(
		location, // attribute location
		count, // count (1, 2, 3 or 4)
		GL_UNSIGNED_INT, // type
		0, // step
		nullptr // offset
	);
}


Nothing that you've posted should be causing it to run that slowly. You're not making the common mistake of loading the mesh every frame, are you?

14 minutes ago, OandO said:

You're not making the common mistake of loading the mesh every frame, are you?

No, the get*Buffer functions return only the value from the array:


inline GLuint getVerticesBuffer() {
	return buffers[0];
}

There are no other similar places. I load the mesh only 1 time

Are you sure the problem is not in the shaders? If changing your window size affects the performance so much, maybe your fragment shader is doing something slowly.

Other than that, have you tried profiling your program? That may help to determine if the bottleneck is on CPU or GPU side.

9 minutes ago, 1024 said:

Are you sure the problem is not in the shaders?

If there was a problem in the fragment shader, I suppose that the loss when rendering depth cubemaps would be much less. Depth cubemaps resolution:
1024x1024: 25 (24.1861) FPS, 41.346 ms

2048x2048: 24 (23.239) FPS, 43.0311 ms

28 minutes ago, 1024 said:

Other than that, have you tried profiling your program?

I cannot profile as I get the following message: main: /build/glfw3-N0skBB/glfw3-3.2.1/src/input.c:462: glfwSetKeyCallback: Assertion `window != NULL' failed.
 

You get that message only when profiling but not when running regularly? That should not happen. Unfortunately, I can't help you with that, but something must be wrong in the way you set it up.

Are you using branch statements ( if ) in your shader code?

Try to measure execution times of several parts of your program to narrow down the OpenGL API call that is responsible for the slow down.

Here is the profiling file generated by renderdoc: profile.zip.xml

My shaders code: vertex_shader.glsl, fragment_shader.glsl

I apologize that the fragment shader is difficult to read, I have not yet fully completed work on it

This topic is closed to new replies.

Advertisement