AMD has released the Radeon GPU Profiler 1.5.1. The low-level GPU optimization tool provides details timing and occupancy information on Radeon GPUs. New to this release is Instruction Timing, Shader ISA in the pipeline state pane, and improved user marker display, grouping, and filtering.
Now developers can use the built in hardware-level tracing support to dump instruction level trace data during a capture to understand how each instruction performs without doing anything special besides profile a frame.
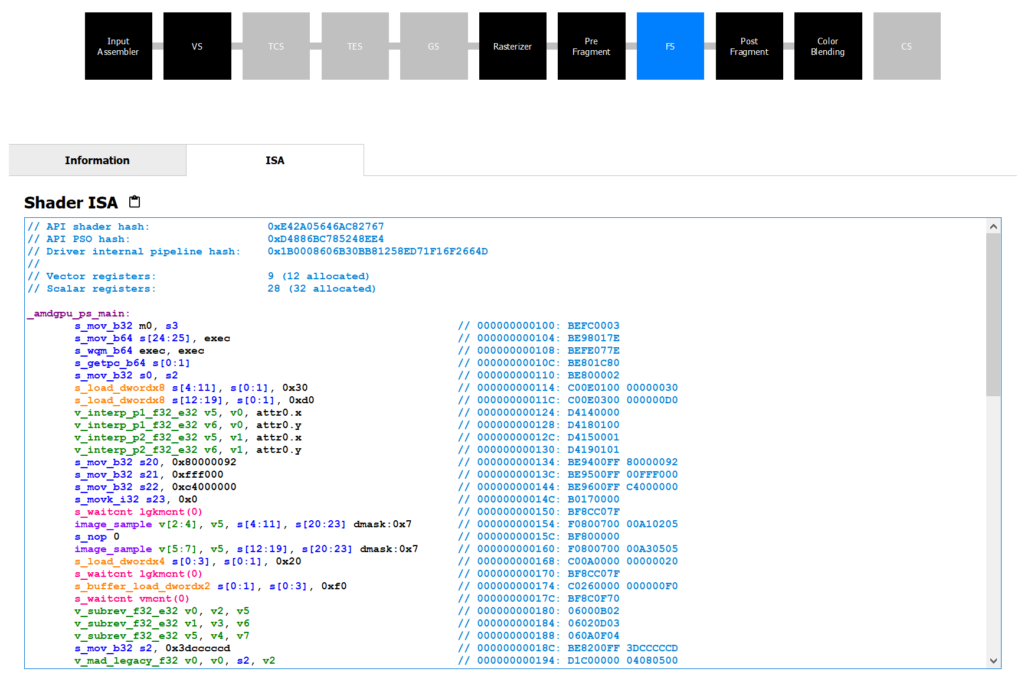
Developers also now can view the embedded GPU ISA for each active shader stage. Two tabs show the information about the hardware occupancy of the particular event you're interested in, and a new tab labelled ISA to show the hardware instructions sent to the GPU after being compiled from the higher level language you submitted with the dispatch or draw using one of Radeon GPU Profiler's supported high-level APIs.
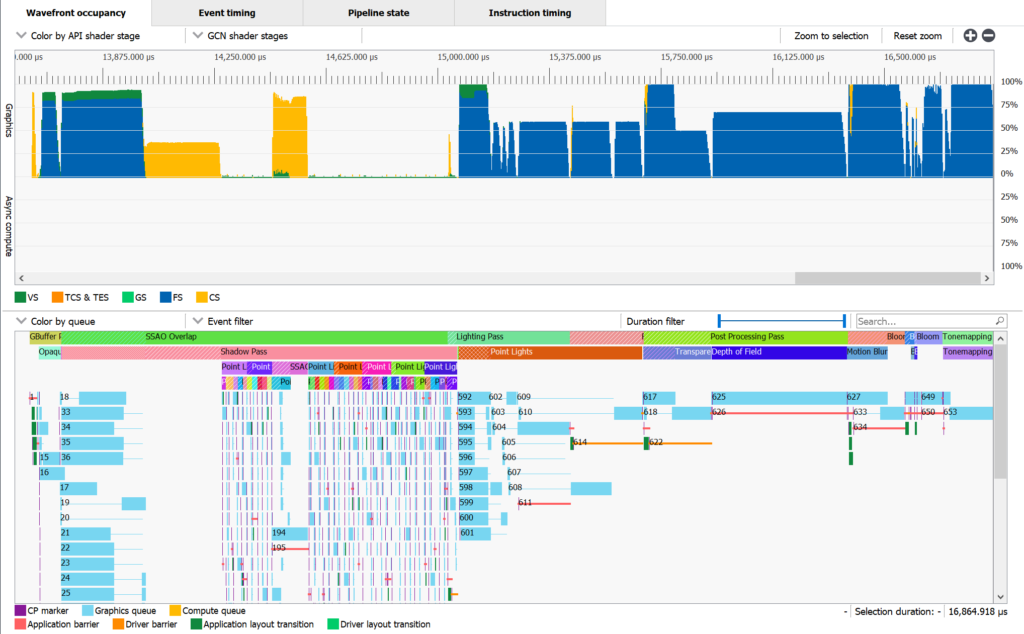
Finally, user markers are now shown in a capture event view on top of the event, helping developers get a better idea how their frame is put together.
Check out the full announcement at https://gpuopen.com/radeon-gpu-profiler-1-5-1/.