
What I want to do is to simulate exactly the shaking of the spring in this animation:
The way I thought to do this is to split the gif into frames (30 frames in total). Then I took the spring position in each frame and calculated the difference of the spring position in each frame from the previous position (for example springPosition1 - springPosition0). The graph of all these differences looks like this:
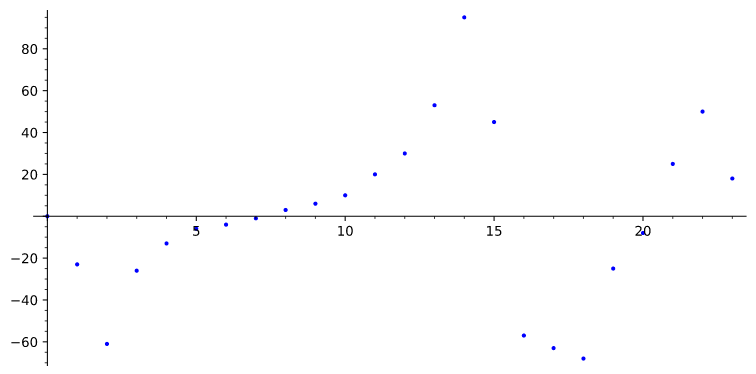
I constructed this graph as an approximately cubic bezier curve. Then, since the first derivative of each point of the curve represents the velocity, I thought to add the first derivative of each point to the position of the spring:
var total_delta: float = 0
func _physics_process(delta):
   spring.position.y += Bezier.get_velocity(total_delta)
   total_delta += delta
Here is the animation I got:
As you can see, I did not achieve the desired result. Where do you think the problem lies? My guess is that the curve I showed above needs more zigzags to be like a spring. It seems strange to me that there are so few zigzags, but this is what a position-time graph looks like. It confuses me that the animation is not accurate but the position-time graph is. What solution would you suggest to make this animation?


