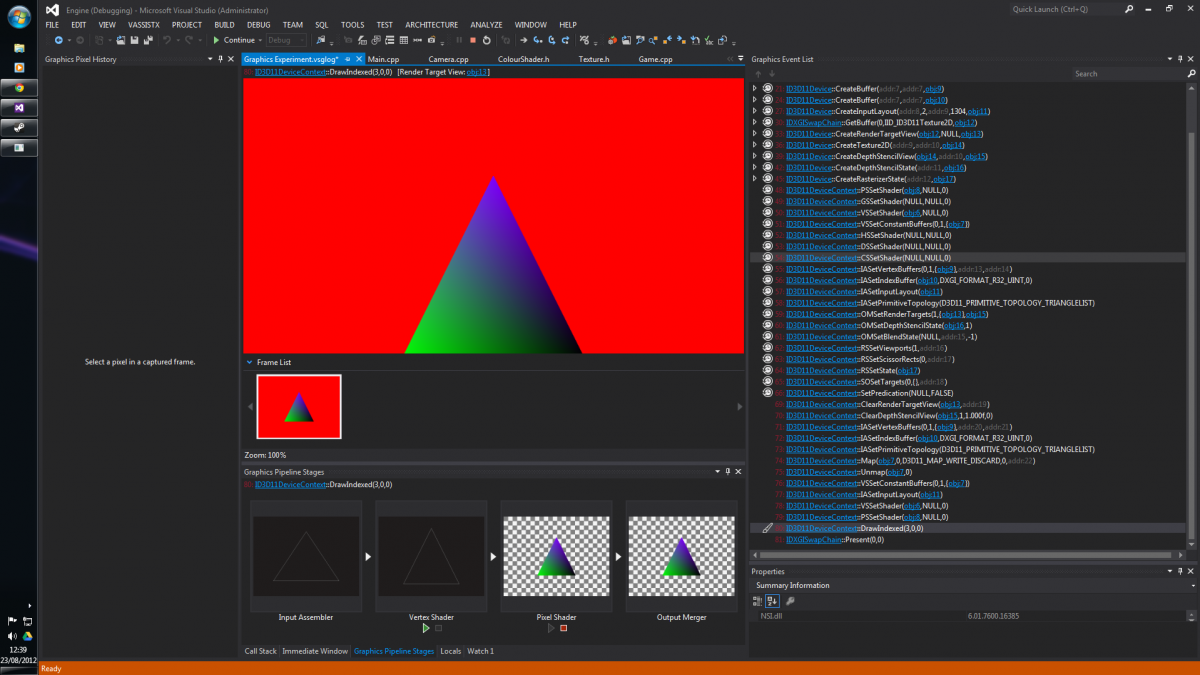
You can see all of the DirectX calls and the render targets as they existed at each point in time. You can click on a single pixel and they can tell you which draw calls affected that pixel and how. Stepping through the shaders (black magic) allowed you to visually see the effects of the shader code and verify them with the output in the render targets. Contents of Vertex and Index buffers are easily displayed and even viewed in 3D preview.
So now, it's 2012 and Microsoft has caught up and released a suite of graphics debugging tools in their newest Visual Studio (11 / 2012). Having access to every little piece of the puzzle means people are able to diagnose bugs more quickly and in my experience, the graphical bugs are some of the hardest to understand.
Currently, nSight doesn't work with Visual Studio 2012. I wonder if they are going to update it or if they feel it's a fruitless endeavour, given Microsoft's new found efforts in this area.