
GPU Performance for Game Artists
We rely on artists to produce assets that not only look good but are also efficient to render. For artists, a little knowledge of what goes on under the hood can make a big impact on a game

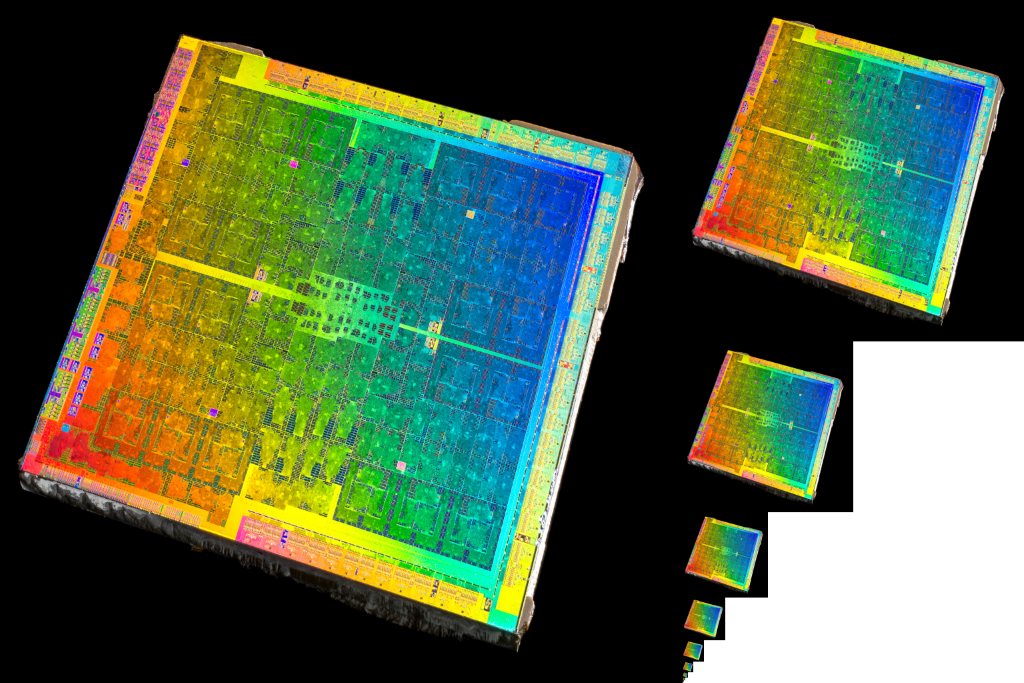
Performance is everybody's responsibility, no matter what your role. When it comes to the GPU, 3D programmers have a lot of control over performance; we can optimize shaders, trade image quality for performance, use smarter rendering techniques... we have plenty of tricks up our sleeves. But there's one thing we don't have direct control over, and that's the game's art. We rely on artists to produce assets that not only look good but are also efficient to render. For artists, a little knowledge of what goes on under the hood can make a big impact on a game's framerate. If you're an artist and want to understand why things like draw calls, LODs, and mipmaps are important for performance, read on! To appreciate the impact that your art has on the game's performance, you need to know how a mesh makes its way from your modelling package onto the screen in the game. That means having an understanding of the GPU - the chip that powers your graphics card and makes real-time 3D rendering possible in the first place. Armed with that knowledge, we'll look at some common art-related performance issues, why they're a problem, and what you can do about it. Things are quickly going to get pretty technical, but if anything is unclear I'll be more than happy to answer questions in the comments section. Before we start, I should point out that I am going to deliberately simplify a lot of things for the sake of brevity and clarity. In many cases I'm generalizing, describing only the typical case, or just straight up leaving things out. In particular, for the sake of simplicity the idealized version of the GPU I describe below more closely matches that of the previous (DX9-era) generation. However when it comes to performance, all of the considerations below still apply to the latest PC & console hardware (although not necessarily all mobile GPUs). Once you understand everything described here, it will be much easier to get to grips with the variations and complexities you'll encounter later, if and when you start to dig deeper.
Part 1: The rendering pipeline from 10,000 feet
For a mesh to be displayed on the screen, it must pass through the GPU to be processed and rendered. Conceptually, this path is very simple: the mesh is loaded, vertices are grouped together as triangles, the triangles are converted into pixels, each pixel is given a colour, and that's the final image. Let's look a little closer at what happens at each stage. After you export a mesh from your DCC tool of choice (Digital Content Creation - Maya, Max, etc.), the geometry is typically loaded into the game engine in two pieces; a Vertex Buffer (VB) that contains a list of the mesh's vertices and their associated properties (position, UV coordinates, normal, color etc.), and an Index Buffer (IB) that lists which vertices in the VB are connected to form triangles. Along with these geometry buffers, the mesh will also have been assigned a material to determine what it looks like and how it behaves under different lighting conditions. To the GPU this material takes the form of custom-written shaders - programs that determine how the vertices are processed, and what colour the resulting pixels will be. When choosing the material for the mesh, you will have set various material parameters (eg. setting a base color value or picking a texture for various maps like albedo, roughness, normal etc.) - these are passed to the shader programs as inputs. The mesh and material data get processed by various stages of the GPU pipeline in order to produce pixels in the final render target (an image to which the GPU writes). That render target can then be used as a texture in subsequent shader programs and/or displayed on screen as the final image for the frame. For the purposes of this article, here are the important parts of the GPU pipeline from top to bottom: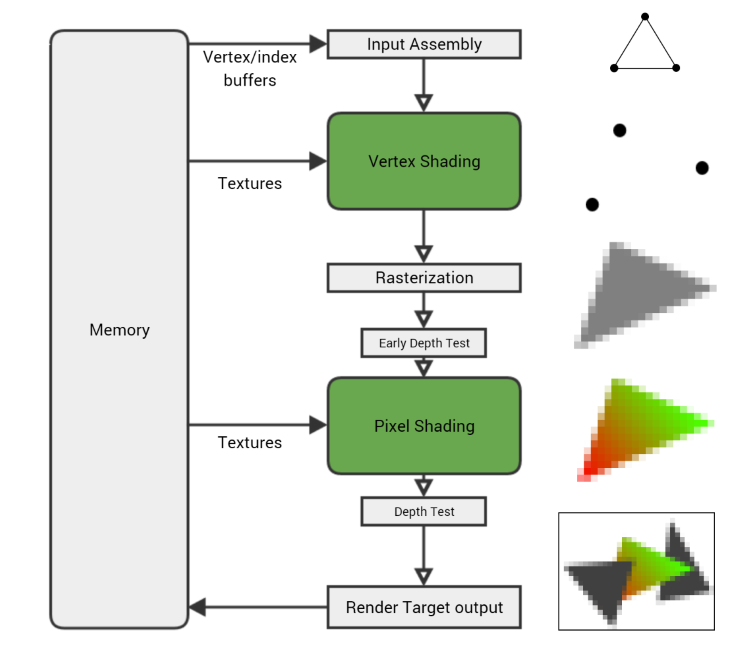
- Input Assembly. The GPU reads the vertex and index buffers from memory, determines how the vertices are connected to form triangles, and feeds the rest of the pipeline.
- Vertex Shading. The vertex shader gets executed once for every vertex in the mesh, running on a single vertex at a time. Its main purpose is to transform the vertex, taking its position and using the current camera and viewport settings to calculate where it will end up on the screen.
- Rasterization. Once the vertex shader has been run on each vertex of a triangle and the GPU knows where it will appear on screen, the triangle is rasterized - converted into a collection of individual pixels. Per-vertex values - UV coordinates, vertex color, normal, etc. - are interpolated across the triangle's pixels. So if one vertex of a triangle has a black vertex color and another has white, a pixel rasterized in the middle of the two will get the interpolated vertex color grey.
- Pixel Shading. Each rasterized pixel is then run through the pixel shader (although technically at this stage it's not yet a pixel but 'fragment', which is why you'll see the pixel shader sometimes called a fragment shader). This gives the pixel a color by combining material properties, textures, lights, and other parameters in the programmed way to get a particular look. Since there are so many pixels (a 1080p render target has over two million) and each one needs to be shaded at least once, the pixel shader is usually where the GPU spends a lot of its time.
- Render Target Output. Finally the pixel is written to the render target - but not before undergoing some tests to make sure it's valid. For example in normal rendering you want closer objects to appear in front of farther objects; the depth test can reject pixels that are further away than the pixel already in the render target. But if the pixel passes all the tests (depth, alpha, stencil etc.), it gets written to the render target in memory.
float3 MaterialColor; Texture2D MaterialTexture; SamplerState TexSampler; float3 LightDirection; float3 LightColor; float4 MyPixelShader( float2 vUV : TEXCOORD0, float3 vNorm : NORMAL0 ) : SV_Target { float3 vertexNormal = normalize(vNorm); float3 lighting = LightColor * dot( vertexNormal, LightDirection ); float3 material = MaterialColor * MaterialTexture.Sample( TexSampler, vUV ).rgb; float3 color = material * lighting; float alpha = 1; return float4(color, alpha); } A simple pixel shader that does basic lighting. The inputs at the top like MaterialTexture and LightColor are filled in by the CPU, while vUV and vNorm are both vertex properties that were interpolated across the triangle during rasterization. And the generated shader instructions: dp3 r0.x, v1.xyzx, v1.xyzx rsq r0.x, r0.x mul r0.xyz, r0.xxxx, v1.xyzx dp3 r0.x, r0.xyzx, cb0[1].xyzx mul r0.xyz, r0.xxxx, cb0[2].xyzx sample_indexable(texture2d)(float,float,float,float) r1.xyz, v0.xyxx, t0.xyzw, s0 mul r1.xyz, r1.xyzx, cb0[0].xyzx mul o0.xyz, r0.xyzx, r1.xyzx mov o0.w, l(1.000000) ret The shader compiler takes the above program and generates these instructions which are run on the GPU; a longer program produces more instructions which means more work for the GPU to do. As an aside, you might notice how isolated the shader steps are - each shader works on a single vertex or pixel without needing to know anything about the surrounding vertices/pixels. This is intentional and allows the GPU to process huge numbers of independent vertices and pixels in parallel, which is part of what makes GPUs so fast at doing graphics work compared to CPUs. We'll return to the pipeline shortly to see where things might slow down, but first we need to back up a bit and look at how the mesh and material got to the GPU in the first place. This is also where we meet our first performance hurdle - the draw call. The CPU and Draw Calls
The GPU cannot work alone; it relies on the game code running on the machine's main processor - the CPU - to tell it what to render and how. The CPU and GPU are (usually) separate chips, running independently and in parallel. To hit our target frame rate - most commonly 30 frames per second - both the CPU and GPU have to do all the work to produce a single frame within the time allowed (at 30fps that's just 33 milliseconds per frame).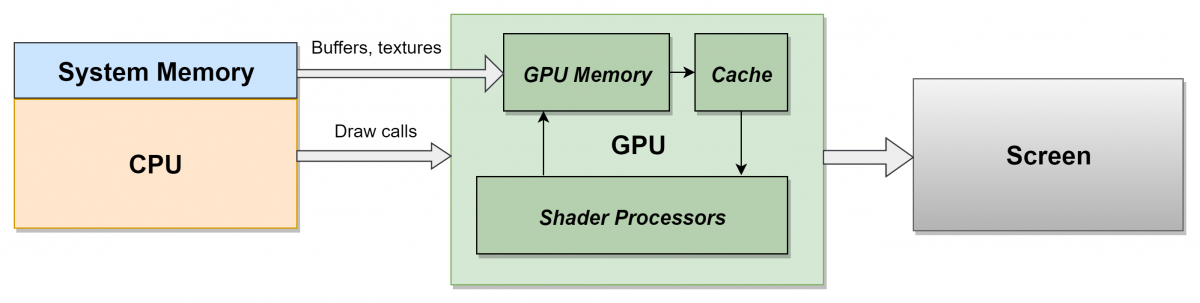
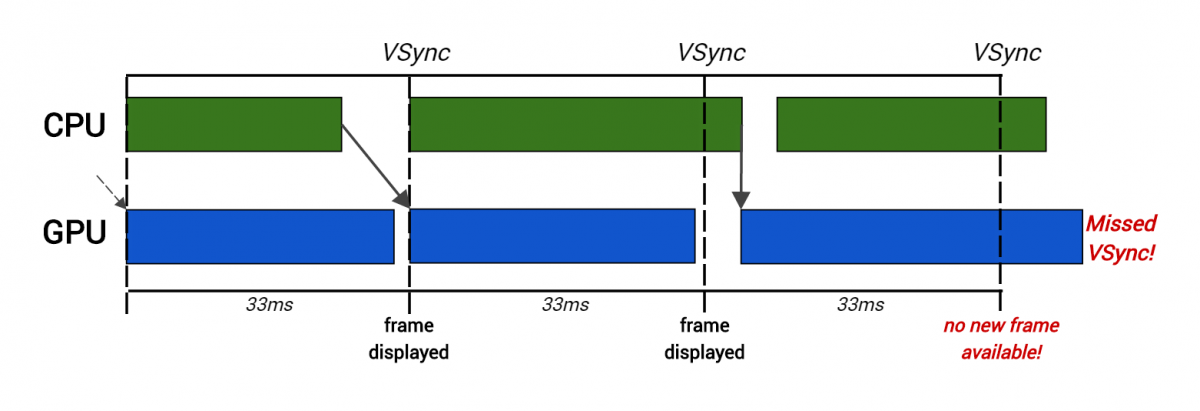 Here the CPU takes too long to produce rendering commands for the second frame, so the GPU starts rendering late and thus misses VSync.
 A texture atlas from Unreal Engine's Infiltrator demo
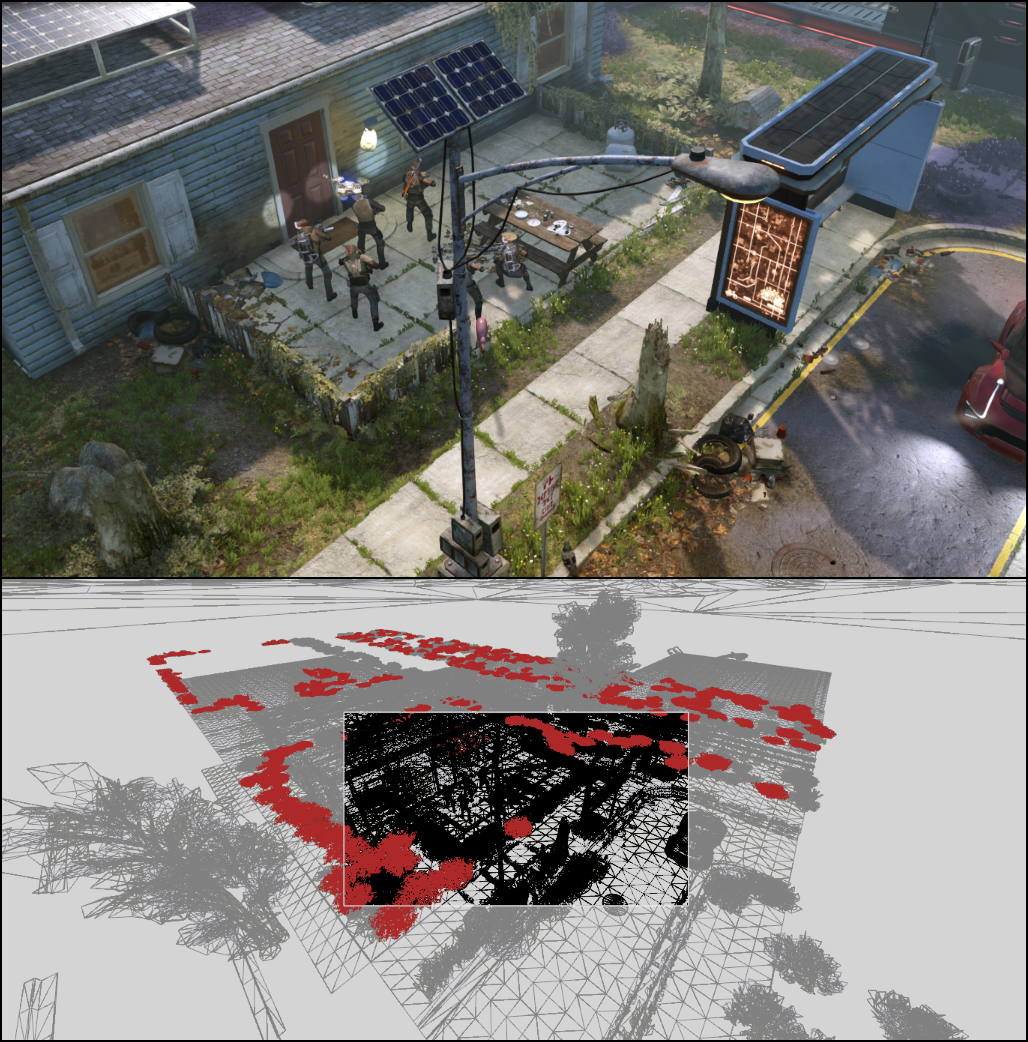 A frame from XCOM 2 as captured with RenderDoc. The wireframe (bottom) shows in grey all the extra geometry submitted to the GPU that is outside the view of the in-game camera.
Part 2: Common GPU bottlenecks
The very first step in optimization is to identify the current bottleneck so you can take steps to reduce or eliminate it. A bottleneck refers to the section of the pipeline that is slowing everything else down. In the above case where too many draw calls are costing too much, the CPU is the bottleneck. Even if we performed other optimizations that made the GPU faster, it wouldn't matter to the framerate because the CPU is still running too slowly to produce a frame in the required amount of time.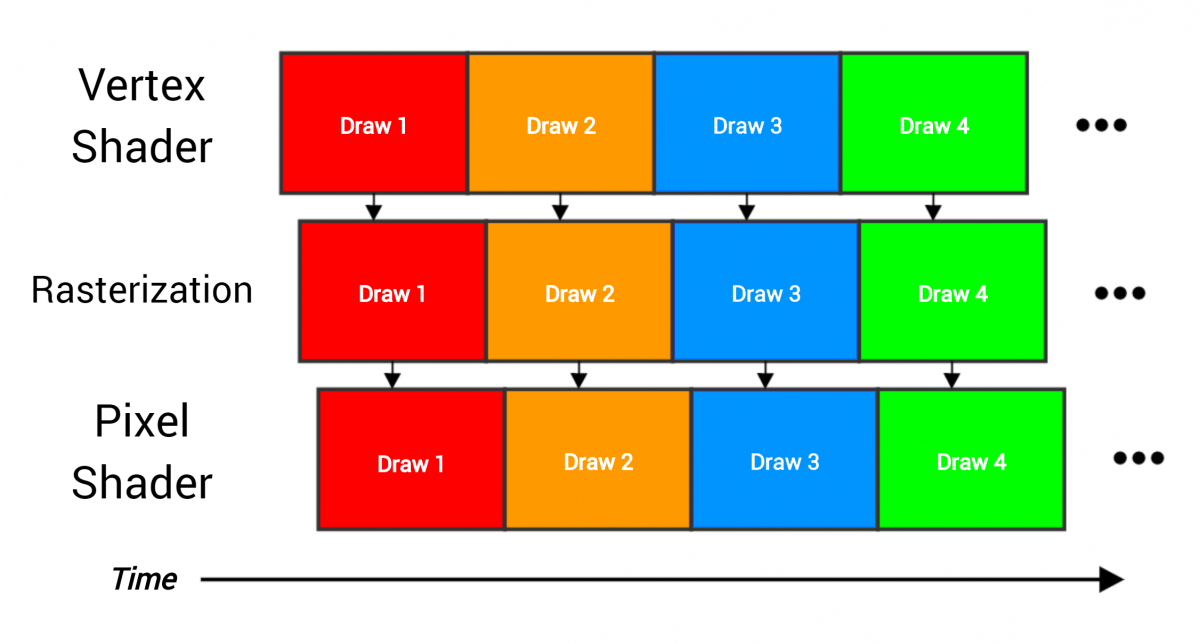 4 draw calls going through the pipeline, each being the rendering of a full mesh containing many triangles. The stages overlap because as soon as one piece of work is finished it can be immediately passed to the next stage (eg. when three vertices are processed by the vertex shader then the triangle can proceed to be rasterized).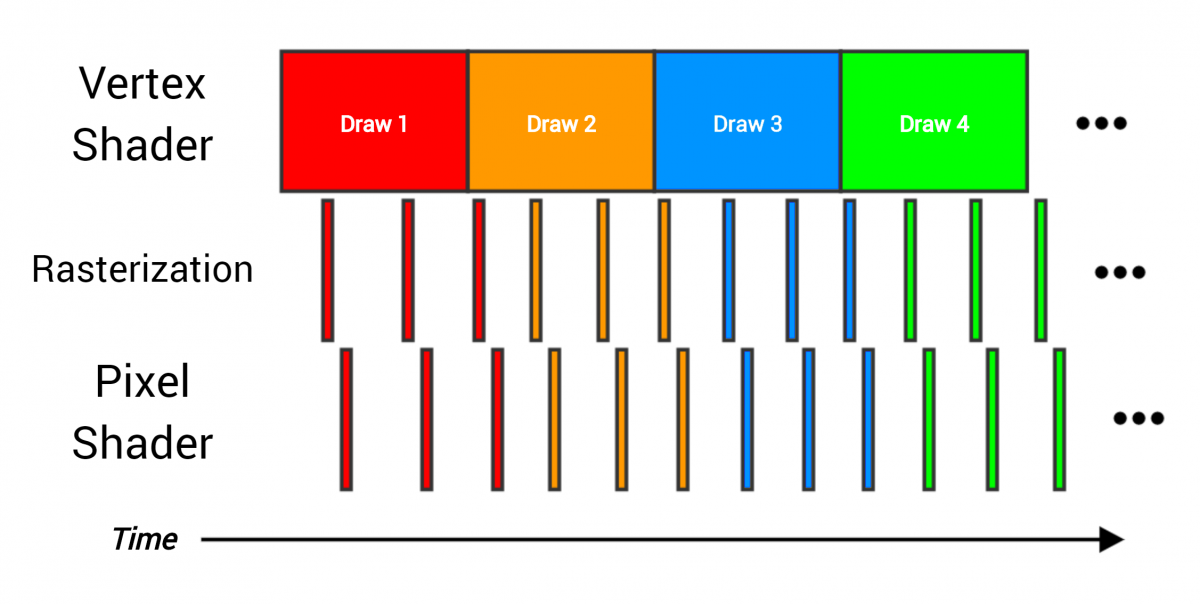
Profiling
Profiling tools are absolutely essential for figuring out where all the GPU's time is being spent, and good ones will point you at exactly what you need to change in order for things to go faster. They do this in a variety of ways - some explicitly show a list of bottlenecks, others let you run 'experiments' to see what happens (eg. "how does my draw time change if all the textures are tiny", which can tell you if you're bound by memory bandwidth or cache usage). Unfortunately this is where things get a bit hand-wavy, because some of the best performance tools available are only available for the consoles and therefore under NDA. If you're developing for Xbox or Playstation, bug your friendly neighbourhood graphics programmer to show you these tools. We love it when artists get involved in performance, and will be happy to answer questions and even host tutorials on how to use the tools effectively.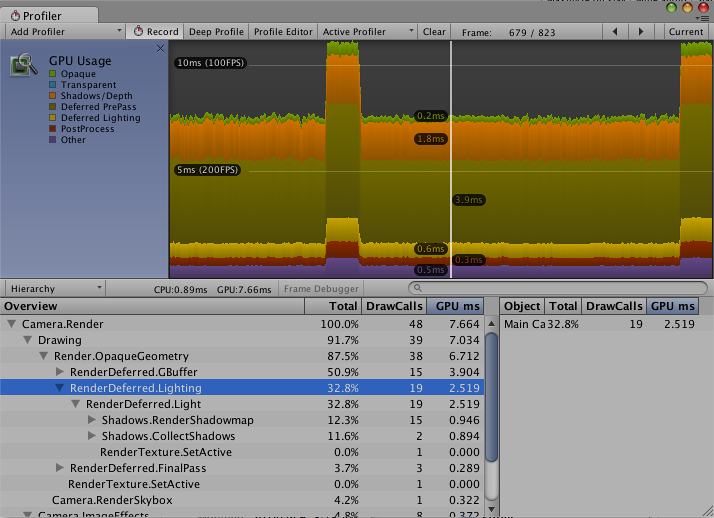 Unity's basic built-in GPU profiler
Shader instructions
Since most of the GPU's work is done with shaders, they're often the source of many bottlenecks of the you'll see. When a bottleneck is identified as shader instructions (sometimes referred to as ALUs from Arithmetic Logic Units, the hardware that actually does the calculations), it's simply a way of saying the vertex or pixel shader is doing a lot of work and the rest of the pipeline is waiting for that work to finish. Often the vertex or pixel shader program itself is just too complex, containing many instructions and taking a long time to execute. Or maybe the vertex shader is reasonable but the mesh you're rendering has too many vertices which adds up to a lot of time spent executing the vertex shader. Or the draw call covers a large area of the screen touching many pixels, and so spends a lot of time in the pixel shader. Unsurprisingly, the best way to optimize a shader instruction bottleneck is to execute less instructions! For pixel shaders that means choosing a simpler material with less features to reduce the number of instructions executed per pixel. For vertex shaders it means simplifying your mesh to reduce the number of vertices that need to be processed, as well as being sure to use LODs (Level Of Detail - simplified versions of your mesh for use when the object is far away and small on the screen). Sometimes however, shader instruction bottlenecks are instead just an indication of problems in some other area. Issues such as too much overdraw, a misbehaving LOD system, and many others can cause the GPU to do a lot more work than necessary. These problems can be either on the engine side or the content side; careful profiling, examination, and experience will help you to figure out what's really going on. One of the most common of these issues - overdraw - is when the same pixel on the screen needs to be shaded multiple times, because it's touched by multiple draw calls. Overdraw is a problem because it decreases the overall time the GPU has to spend on rendering. If every pixel on the screen has to be shaded twice, the GPU can only spend half the amount of time on each pixel and still maintain the same framerate.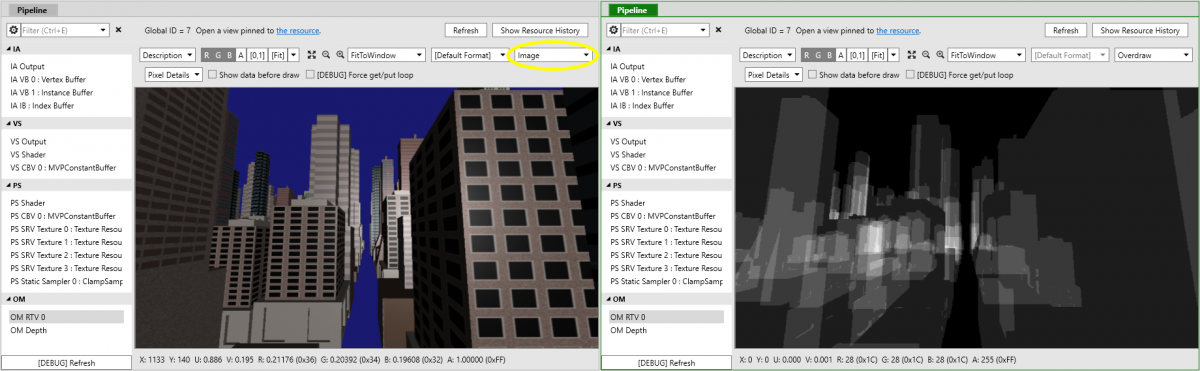 A frame capture from PIX with the corresponding overdraw visualization mode
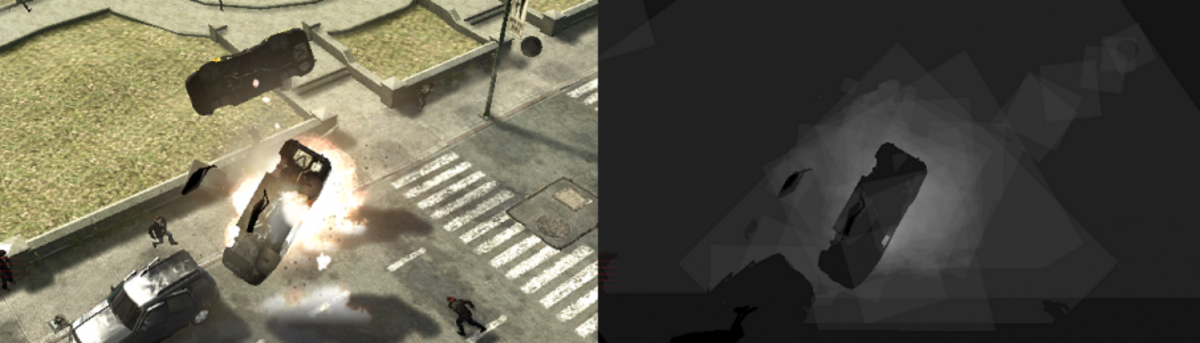 Particle overdraw visualization of an explosion in Prototype 2
 Particle 'cutout' tool in Unreal Engine 4
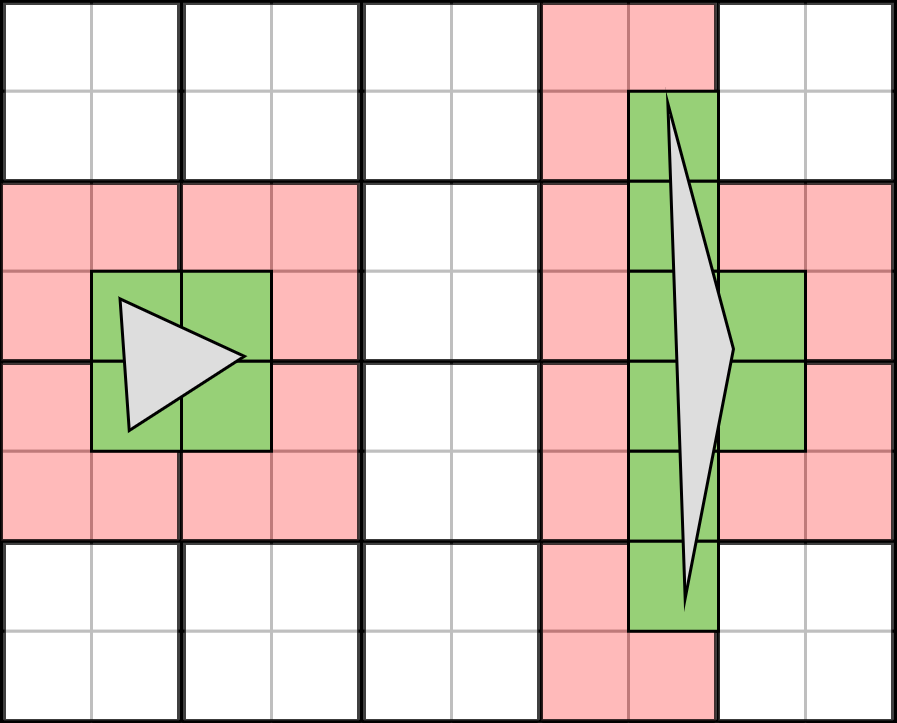 A 10x8 pixel buffer with 5x4 quads. The two triangles have poor quad utilization -- left is too small, right is too thin. The 10 red quads touched by the triangles need to be completely shaded, even though the 12 green pixels are the only ones that are actually needed. Overall, 70% of the GPU's work is wasted.
Memory Bandwidth and Textures
As illustrated in the above diagram of the GPU pipeline, meshes and textures are stored in memory that is physically separate from the GPU's shader processors. That means that whenever the GPU needs to access some piece of data, like a texture being fetched by a pixel shader, it needs to retrieve it from memory before it can actually use it as part of its calculations. Memory accesses are analogous to downloading files from the internet. File downloads take a certain amount of time due to the internet connection's bandwidth - the speed at which data can be transferred. That bandwidth is also shared between all downloads - if you can download one file at 6MB/s, two files only download at 3MB/s each. The same is true of memory accesses; index/vertex buffers and textures being accessed by the GPU take time, and must share memory bandwidth. The speeds are obviously much higher than internet connections - on paper the PS4's GPU memory bandwidth is 176GB/s - but the idea is the same. A shader that accesses many textures will rely heavily on having enough bandwidth to transfer all the data it needs in the time it needs it. Shaders programs are executed by the GPU with these restrictions in mind. A shader that needs to access a texture will try to start the transfer as early as possible, then do other unrelated work (for example lighting calculations) and hope that the texture data has arrived from memory by the time it gets to the part of the program that needs it. If the data hasn't arrived in time - because the transfer is slowed down by lots of other transfers, or because it runs out of other work to do (especially likely for dependent texture fetches) - execution will stop and it will just sit there and wait. This is a memory bandwidth bottleneck; making the rest of the shader faster will not matter if it still needs to stop and wait for data to arrive from memory. The only way to optimize this is to reduce the amount of bandwidth being used, or the amount of data being transferred, or both. Memory bandwidth might even have to be shared with the CPU or async compute work that the GPU is doing at the same time. It's a very precious resource. The majority of memory bandwidth is usually taken up by texture transfers, since textures contain so much data. As a result, there are a few different mechanisms in place to reduce the amount of texture data that needs to be shuffled around. Memory bandwidth might even have to be shared with the CPU or async compute work that the GPU is doing at the same time. It's a very precious resource. The majority of memory bandwidth is usually taken up by texture transfers, since textures contain so much data. As a result, there are a few different mechanisms in place to reduce the amount of texture data that needs to be shuffled around. First and foremost is a cache. This is a small piece of high-speed memory that the GPU has very fast access to, and is used to keep chunks of memory that have been accessed recently in case the GPU needs them again. In the internet connection analogy, the cache is your computer's hard drive that stores the downloaded files for faster access in the future. When a piece of memory is accessed, like a single texel in a texture, the surrounding texels are also pulled into the cache in the same memory transfer. The next time the GPU looks for one of those texels, it doesn't need to go all the way to memory and can instead fetch it from the cache extremely quickly. This is actually often the common case - when a texel is displayed on the screen in one pixel, it's very likely that the pixel beside it will need to show the same texel, or the texel right beside it in the texture. When that happens, nothing needs to be transferred from memory, no bandwidth is used, and the GPU can access the cached data almost instantly. Caches are therefore vitally important for avoiding memory-related bottlenecks. Especially when you take filtering into account - bilinear, trilinear, and anisotropic filtering all require multiple texels to be accessed for each lookup, putting an extra burden on bandwidth usage. High-quality anisotropic filtering is particularly bandwidth-intensive. Now think about what happens in the cache if you try to display a large texture (eg. 2048x2048) on an object that's very far away and only takes up a few pixels on the screen. Each pixel will need to fetch from a very different part of the texture, and the cache will be completely ineffective since it only keeps texels that were close to previous accesses. Every texture access will try to find its result in the cache and fail (called a 'cache miss') and so the data must be fetched from memory, incurring the dual costs of bandwidth usage and the time it takes for the data to be transferred. A stall may occur, slowing the whole shader down. It will also cause other (potentially useful) data to be 'evicted' from the cache in order to make room for the surrounding texels that will never even be used, reducing the overall efficiency of the cache. It's bad news all around, and that's not to even mention the visual quality issues - tiny movements of the camera will cause completely different texels to be sampled, causing aliasing and sparkling. This is where mipmapping comes to the rescue. When a texture fetch is issued, the GPU can analyze the texture coordinates being used at each pixel, determining when there is a large gap between texture accesses. Instead of incurring the costs of a cache miss for every texel, it instead accesses a lower mip of the texture that matches the resolution it's looking for. This greatly increases the effectiveness of the cache, reducing memory bandwidth usage and the potential for a bandwidth-related bottleneck. Lower mips are also smaller and need less data to be transferred from memory, further reducing bandwidth usage. And finally, since mips are pre-filtered, their use also vastly reduces aliasing and sparkling. For all of these reasons, it's almost always a good idea to use mipmaps - the advantages are definitely worth the extra memory usage.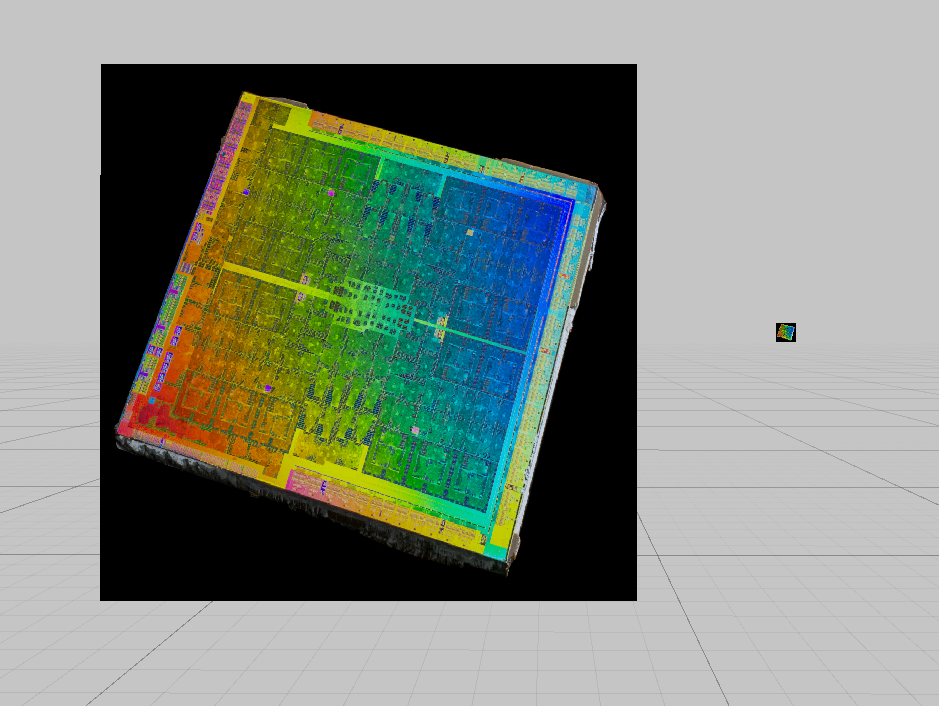 A texture on two quads, one close to the camera and one much further away
 The same texture with a corresponding mipmap chain, each mip being half the size of the previous one
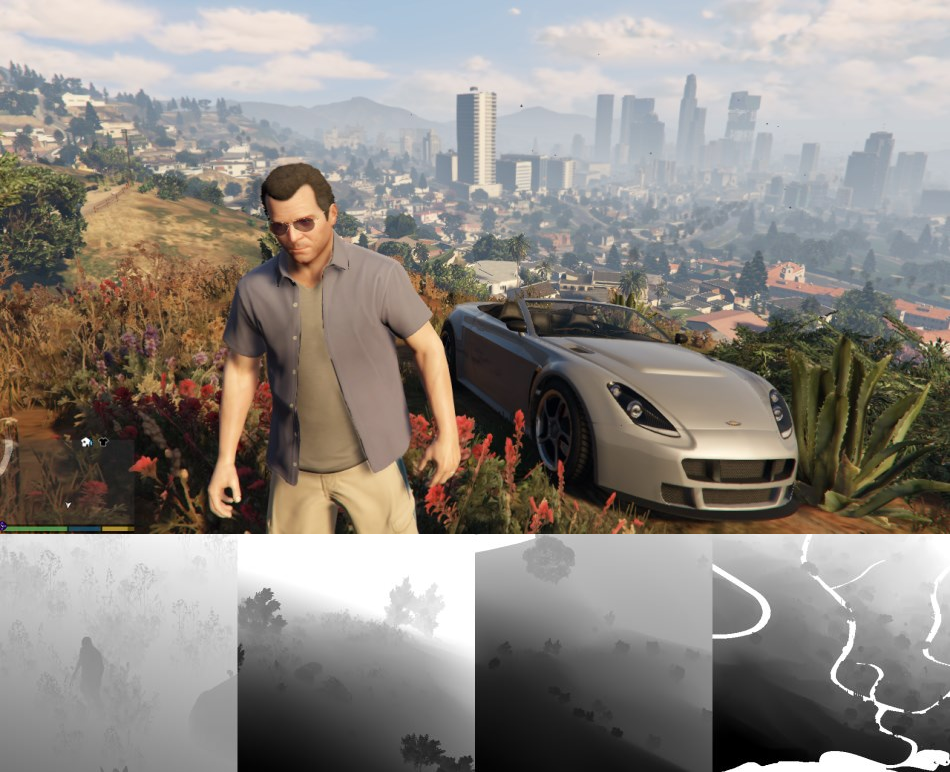 A frame from GTA V with shadow maps, courtesy of Adrian Courr?ges' great frame analysis
And there's more...
As you've probably gathered by now, GPUs are complex pieces of hardware. When fed properly, they are capable of processing an enormous amount of data and performing billions of calculations every second. On the other hand, bad data and poor usage can slow them down to a crawl, having a devastating effect on the game's framerate. There are many more things that could be discussed or expanded upon, but what's above is a good place to start for any technically-minded artist. Having an understanding of how the GPU works can help you produce art that not only looks great but also performs well... and better performance can let you improve your art even more, making the game look better too. There's a lot to take in here, but remember that your 3D programming team is always happy to sit down with you and discuss anything that needs more explanation - as am I in the comments section below!Further Technical Reading
- Render Hell - Simon Tr?mpler
- Texture filtering: mipmaps - Shawn Hargreaves
- Graphics Gems for Games - Findings from Avalanche Studios - Emil Persson
- Triangulation - Emil Persson
- How bad are small triangles on GPU and why? - Christophe Riccio
- Game Art Tricks - Simon Tr?mpler
- Optimizing the rendering of a particle system - Christer Ericson
- Practical Texture Atlases - Ivan-Assen Ivanov
- How GPUs Work - David Luebke & Greg Humphreys
- Casual Introduction to Low-Level Graphics Programming - Stephanie Hurlburt
- Counting Quads - Stephen Hill
- Overdraw in Overdrive - Stephen Hill
- Life of a triangle - NVIDIA's logical pipeline - NVIDIA
- From Shader Code to a Teraflop: How Shader Cores Work - Kayvon Fatahalian
- A Trip Through the Graphics Pipeline (2011) - Fabian Giesen
Related Tutorials

Procedural Generation of 2D Tile Maps in Games
The article explains how to build a procedural 2D cave map generator using cellular automata. It covers map representat…

Localizing A Game Into French — Which Variant Should You Choose?
So, you’re making an awesome indie game, and now you’re thinking about localizing it into French? Great idea! There ar…
 Level Up Translation

How Long Does It Take To Localize An Indie Game?
So you’re planning on localizing your indie game, but you’re not sure how much time to schedule in. While the timing o…
Level Up Translation

Creating game videos: best practices and pitfalls to avoid
Game video production: practical tips on how to create a game trailer or teaser that you can be proud of. Give your aud…
 Alconost

Adopting CI/CD: How Midwinter Entertainment iterates at speed with the help of IMS
Game development was once like one long sprint: a huge effort until you reached the finish line — at which point you co…
 GameDev.net

5 Things to Consider When Making a Video to Promote Your App or Game
How can you show an app or game in your video in a way that attracts new users? Let’s take a look at what to go by when…
Alconost
Discussion
More from Keith O'Conor
How To Make Games Without Programming
A brief look at some of the options available for creating games without traditional programming.
Jason Astle-Adams

How Augmented Reality is Changing Gaming
Jenn from Scully Creative Labs takes a look at some of the ways Augmented Reality (AR) can enrich the gaming experience.
Jenn Ryan

Latency Matters in Online Gaming
Since interactivity and real-time video are cornerstones of the user experience for game streaming platforms, low laten…
Chris Michaels
Discussion