GameDev.net gamedev.net
🔒 Locked

Triangle rasterization not 'closed' when MSAA enabled?

Started by Koen Mar 6, 2018 at 11:12 AM 17 replies 5.9k views
Original Post
Koen
Koen

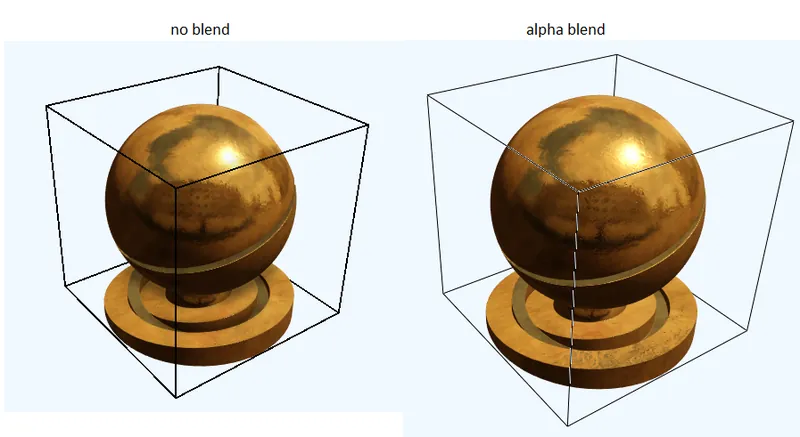
I've run into a puzzling rendering issue where triangles in the back, bleed through triangles in front of them. This screenshot shows the issue:

artefact.png.e8d6b13720ce0218805c74a52b948400.png

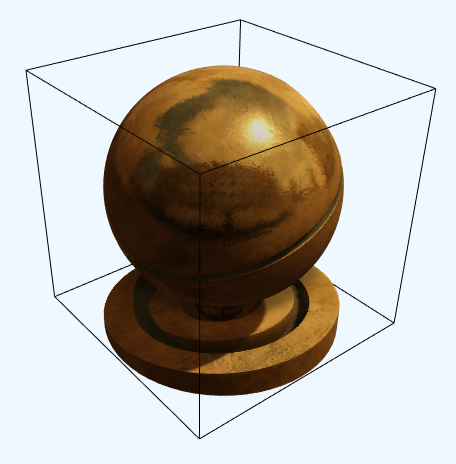
The leftmost picture is drawn with no msaa and shows the expected result. The middle picture is exactly the same, except with msaa enabled. Notice the red pixels bleeding through at some triangle edges. The right picture shows a slightly rotated view, revealing the red surface in the back. In the rotated view, the artefact goes away, apparently because the triangles are no longer directly facing the camera.

The issue only occurs on certain gpus (as far as I am currently aware, nvidia quadro K600 and intel integrated chips).
When using a WARP device or the D3d11 reference rasterizer, the problem does not occur.

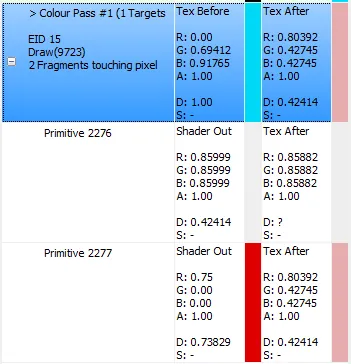
The triangle mesh also affects the result. The two surfaces in the screenshot are pieces of a skull, triangulated from a 3d image scan using some form of marching cubes. So the triangles are in a very specific order. You can also see this in the following RenderDoc pixel history:
renderdoc_pixel_history.png.55834fd390e73a823ca4dbfbd063cde8.png

RenderDoc shows the 'broken' pixel covered by two triangles -- I'd actually expect at least three: two adjacing the edge, and at least one from the back surface. The two triangles affecting the final pixel color are consecutive primitives. The front one has a shader depth output of 0.42414, the back one has a depth of 0.73829, but still ends up affecting the final color.
If I change the order of the triangles -- for instance by splitting the surfaces and rendering each surface with its own draw call -- the problem also goes away.

I understand that msaa changes rasterization, but shouldn't adjacing triangles still be completely without gaps? All sample positions within a pixel should be covered by the triangles on both sides of the edge, so no background should bleed through, right?
For the record: I did check that there are no actual gaps/cracks in the mesh.

Is this a driver/gpu bug? Am I misunderstanding the rasterization rules? Thanks!

Vilem Otte
Vilem Otte

This looks weird at least. If you look at the output of RenderDoc (although I haven't worked with it - can it properly show values per-sample for given pixel (as with MSAA you might have multiple rasterization results per pixel) - as when I work with ray tracers, you mostly have a way to examine results per sample, and not per pixel - in case of super-sampling).

In the Tex After - why is Depth value equal to '?' after Primitive 2276 (which means that value in Depth buffer is undefined at that point, I assume).

And same goes for Depth value for primitive 2277 - if it did pass depth test, shouldn't that value be written in the output?

I'd check what is with your depth testing. Especially this - do you have correct sample count/sample quality set up for the depth buffer?

Krypt0n
Krypt0n

You might be running MSAA with less color than coverage samples, that's called CSAA http://www.nvidia.de/object/coverage-sampled-aa.html

It can lead to these kind of artifacts, simply because the color values might be averaged (as you have to fit e.g. 16 output colors into 4 colors saved colors).

You can change the color and sample count, but that depends on your API. (Check the link for various ways. DX11 and DX12 are very similar to DX10 in that regards).

Hodgman
Hodgman

If you zoom in on the mesh output view, looking at the wireframe, is it actually closed? It could be that there are actually tiny cracks in your mesh that aren't visible at the normal resolution?

FreneticPonE
FreneticPonE

Precision (t-junction) issues might be at fault. Is there a debug view showing the triangles to see if the cracks line up? Basically the internal mesh rendering of these specific GPUs could be throwing whatever precision it thinks is best at your triangles, altering them slightly due to quantization errors and allowing tiny gaps to bleed through.

Koen
Koen

Thanks for all your suggestions.

17 hours ago, Vilem Otte said:

I'd check what is with your depth testing. Especially this - do you have correct sample count/sample quality set up for the depth buffer?

Count is always 8, quality is always 0. Coincidentally there was a new RenderDoc release yesterday, and it allows viewing all samples separately (maybe this was already in before, but I hadn't seen it). This is all the samples for one of the offending pixels (it's a wide image - I hope it doesn't mess up layout too much):

renderdoc_samples.thumb.png.52ba3024ae7ac045948eb3c0015d9371.png

So according to RenderDoc, the depth values are actually ok, but for some reason the latest primitive is always used, regardless of depth. Depth-stencil and blend states all seem fine: depth test less or equal, depth write enabled, blending and stencil test disabled.

14 hours ago, Krypt0n said:

You might be running MSAA with less color than coverage samples, that's called CSAA http://www.nvidia.de/object/coverage-sampled-aa.html

This doesn't seem to be the problem. It is disabled in the nvidia control panel, and I create my render targets with a sample count of 8, and a quality level of 0. It could explain the weird sample results seen in the picture above, though...

10 hours ago, Hodgman said:

It could be that there are actually tiny cracks in your mesh that aren't visible at the normal resolution?


5 hours ago, FreneticPonE said:

Precision (t-junction) issues might be at fault.

I explicitly checked this on cpu side, and in RenderDoc: the triangles use identical vertices, and there are no t-sections. Also, zooming in makes the problem go away instead of making it worse :-)

Running through the code once more, I noticed my depth buffer has the D3D11_BIND_SHADER_RESOURCE flag set (because I 'manually' resolve the depth buffer to non-msaa for dual-depth-peeling transparent objects), which could maybe be a shady practice :-) but removing the flag didn't solve the issue. For the rest, all resources and views seem ok:


Color render target D3D11_TEXTURE2D_DESC
  Width     500                       
  Height    417                       
  MipLevels 1                         
  ArraySize 1                         
  Format    DXGI_FORMAT_B8G8R8A8_UNORM
  SampleDesc DXGI_SAMPLE_DESC()
    Count   8
    Quality 0
  Usage          D3D11_USAGE_DEFAULT     
  BindFlags      D3D11_BIND_RENDER_TARGET
  CPUAccessFlags 0                       
  MiscFlags      0

Render target view D3D11_RENDER_TARGET_VIEW_DESC
  Format        DXGI_FORMAT_B8G8R8A8_UNORM     
  ViewDimension D3D11_RTV_DIMENSION_TEXTURE2DMS
  Texture2DMS   D3D11_TEX2DMS_RTV()

Depth buffer D3D11_TEXTURE2D_DESC
  Width      500                     
  Height     417                     
  MipLevels  1                       
  ArraySize  1                       
  Format     DXGI_FORMAT_R32_TYPELESS
  SampleDesc DXGI_SAMPLE_DESC()
    Count   8
    Quality 0
  Usage          D3D11_USAGE_DEFAULT                               
  BindFlags      D3D11_BIND_SHADER_RESOURCE | D3D11_BIND_DEPTH_STENCIL
  CPUAccessFlags 0                                                 
  MiscFlags      0
  
Depth stencil view D3D11_DEPTH_STENCIL_VIEW_DESC
  Format        DXGI_FORMAT_D32_FLOAT          
  ViewDimension D3D11_DSV_DIMENSION_TEXTURE2DMS
  Flags         0                              
  Texture2DMS   D3D11_TEX2DMS_DSV()


Krypt0n
Krypt0n


1 hour ago, Koen said:

This doesn't seem to be the problem. It is disabled in the nvidia control panel, and I create my render targets with a sample count of 8, and a quality level of 0. It could explain the weird sample results seen in the picture above, though...


Could you give "8" for "Quality" a try? :)

Koen
Koen

Sure! It doesn't fix the issue :-) I had already tried '1' before - also no improvement.

Koen
Koen
47 minutes ago, Krypt0n said:

If you'd share your RD capture, I'd take a look. (no promises I find it, tho! ;) )

No worries. I'm already grateful you're willing to take a look :-) Here it is double_patch.rdc (captured with v1.0).

Krypt0n
Krypt0n

I've checked the output mesh, it seems to be watertight. The Pixelshader also seems to output the proper values. (either pure red, with bg==0 or r==g==b).

watching every individual sample-layer, there are intermediate colors between pure red and pure gray, if that was a rasterization artifact (e.g. due to precision issues), you'd have red or gray, nothing inbetween. This mixing of colors still make me strongly believe CSAA is running. (Maybe the driver ignores your settings or something?)

Have you the same issue with 4xAA? could you ramp up the quality as far as it goes and check the output?

I'm a bit out of ideas. sorry :/

Koen
Koen
19 hours ago, Krypt0n said:

This mixing of colors still make me strongly believe CSAA is running. (Maybe the driver ignores your settings or something?)

Sounds reasonable, but hard to check :)

19 hours ago, Krypt0n said:

Have you the same issue with 4xAA? could you ramp up the quality as far as it goes and check the output?

Yes. 4x and 2x are equally bad. Increasing Quality (at 8 samples, 32 is max on my gpu) actually reduces - but doesn't fix - the problem. I have been sticking to Quality == 0 because that makes it easier to implement. If you want to use the maximum quality level, in theory you'd need to check the minimal maximum quality level for each group of render targets used at the same time. Which is quite some bookkeeping. And if I understood correctly, a higher quality level does not necessarily mean better AA. So I thought: let's just stick to level 0 - which is always valid - and assume the manufacturers have put a decent default at that level :)

19 hours ago, Krypt0n said:

I'm a bit out of ideas. sorry :/

Me too ;) But thanks again for all help and suggestions. I guess I'll just assume this is a gpu/driver issue. I hope once I switch to (vertex cache optimized) indexed rendering, the problem will disappear mostly anyway...

Vilem Otte
Vilem Otte

Just throwing one more idea in - assuming you have the most recent drivers, can you try installing older ones? It is possible that NVidia made some mistake in most recent drivers (in which case reporting it to NVidia is always viable option), it wouldn't be first time a bug was introduced.

Koen
Koen

I downgraded to quadro driver version 385.90 (from November 2017). Didn't help. Oh well, it was worth a try :)

Valdiralita
Valdiralita
On 8.3.2018 at 5:34 PM, Koen said:

I downgraded to quadro driver version 385.90 (from November 2017). Didn't help. Oh well, it was worth a try :)

Hey,

i just registered to let you know how I fixed this. I had exactly the same issues which looked like this:

https://imgur.com/a/sOoa7

It took me about 8hours of debuggung. I found out that the PS Invocation Count is changing from frame to frame by +-50000! Then i changed SV_Coverage to see individual samples and saw that the MSAA samples itself were fine and I knew it had to be a state issue.

So after some playing around I found that if I set


MultisampleEnable = FALSE;

inside the D3D11_RASTERIZER_DESC then Multisampling will still work but there wont be any flickering and holes between polygons!

a.PNG.21ce07cd6214b281aa8c3e0f5cc1f156.PNG

I hope this will help everyone with the same issue!

regards
Valdiralita

Koen
Koen
2 hours ago, Valdiralita said:

I hope this will help everyone with the same issue!

My hero! It sure did fix the issue.

2 hours ago, Valdiralita said:

I found out that the PS Invocation Count is changing from frame to frame by +-50000! Then i changed SV_Coverage to see individual samples and saw that the MSAA samples itself were fine and I knew it had to be a state issue.

I don't see how you came to that conclusion, though :) Or is it just: tried everything else, so it must be a pipeline state?

Also, if anyone happens to have an explanation for this interesting phenomenon where you have to disable msaa to get proper msaa :) I'd be happy to hear.

Thanks again for all the help!

Valdiralita
Valdiralita
5 minutes ago, Koen said:

My hero! It sure did fix the issue.

I don't see how you came to that conclusion, though :) Or is it just: tried everything else, so it must be a pipeline state?

Also, if anyone happens to have an explanation for this interesting phenomenon where you have to disable msaa to get proper msaa :) I'd be happy to hear.

Thanks again for all the help!

Yeah, I pretty much checked EVERYTHING else so it had to be a pipeline state.

Glad that it fixed it for you too. My best guess is that the MultisampleEnable bool is for an automated multisampling and messes up with the manually set sample count.

Oh just another info: This change doesnt work well with line rendering and setting IsAntialiasedLineEnabled to true produces this:

blend.png.3b4ea09348f075ed3f22d5d607e7ee09.png

I ended up creating another RasterizerState that i use for line rendering which uses IsMultisampleEnabled = true and produces the desired result:

result.PNG.d86012506ea484a99cf727e47f4d4358.PNG

regards

Koen
Koen
4 minutes ago, Valdiralita said:

Oh just another info: This change doesnt work well with line rendering

Yup, I already noticed :) My api/gpu abstraction uses a PSO approach with almost all state grouped together, so I can easily detect a request for anti-aliased lines and triangle edges, and create a different rasterizer state for those cases.

I still have to think about how to properly handle tessellation and geometry shaders, though. For now I'll just assume they always produce solid triangles :D

Topic Locked

This topic has been locked by a moderator. New replies are not allowed.

Sign in to reply to this topic.