Rendering 1,000,000 sprites. I'm stuck profiling

Started by
17 comments, last by Green_Baron 4 years, 7 months ago

Hi everyone,

I am attempting to render 1,000,000 sprites on my screen at 60 FPS. I am using OpenGL persistent mapping.

At first, I was using glMapBuffer to do this and I was getting around 32 frames. After using glMapBufferRange / persistent mapping I started getting 34 frames. I have been trying to profile my code and figure out what is going on, and for the life of me, I can't. I know my GPU is just sitting mostly idle. So it is a CPU bottleneck. I fired up VS 2019 CPU profiler and tried to see why my CPU bottlenecked and I can't figure it out. All I know is that my CPU is spending around 70% of its time in the function that maps the sprite

I am building this in release x64 bit mode

profile.thumb.png.3406c09246e87cabc0268da1e92eff6a.png


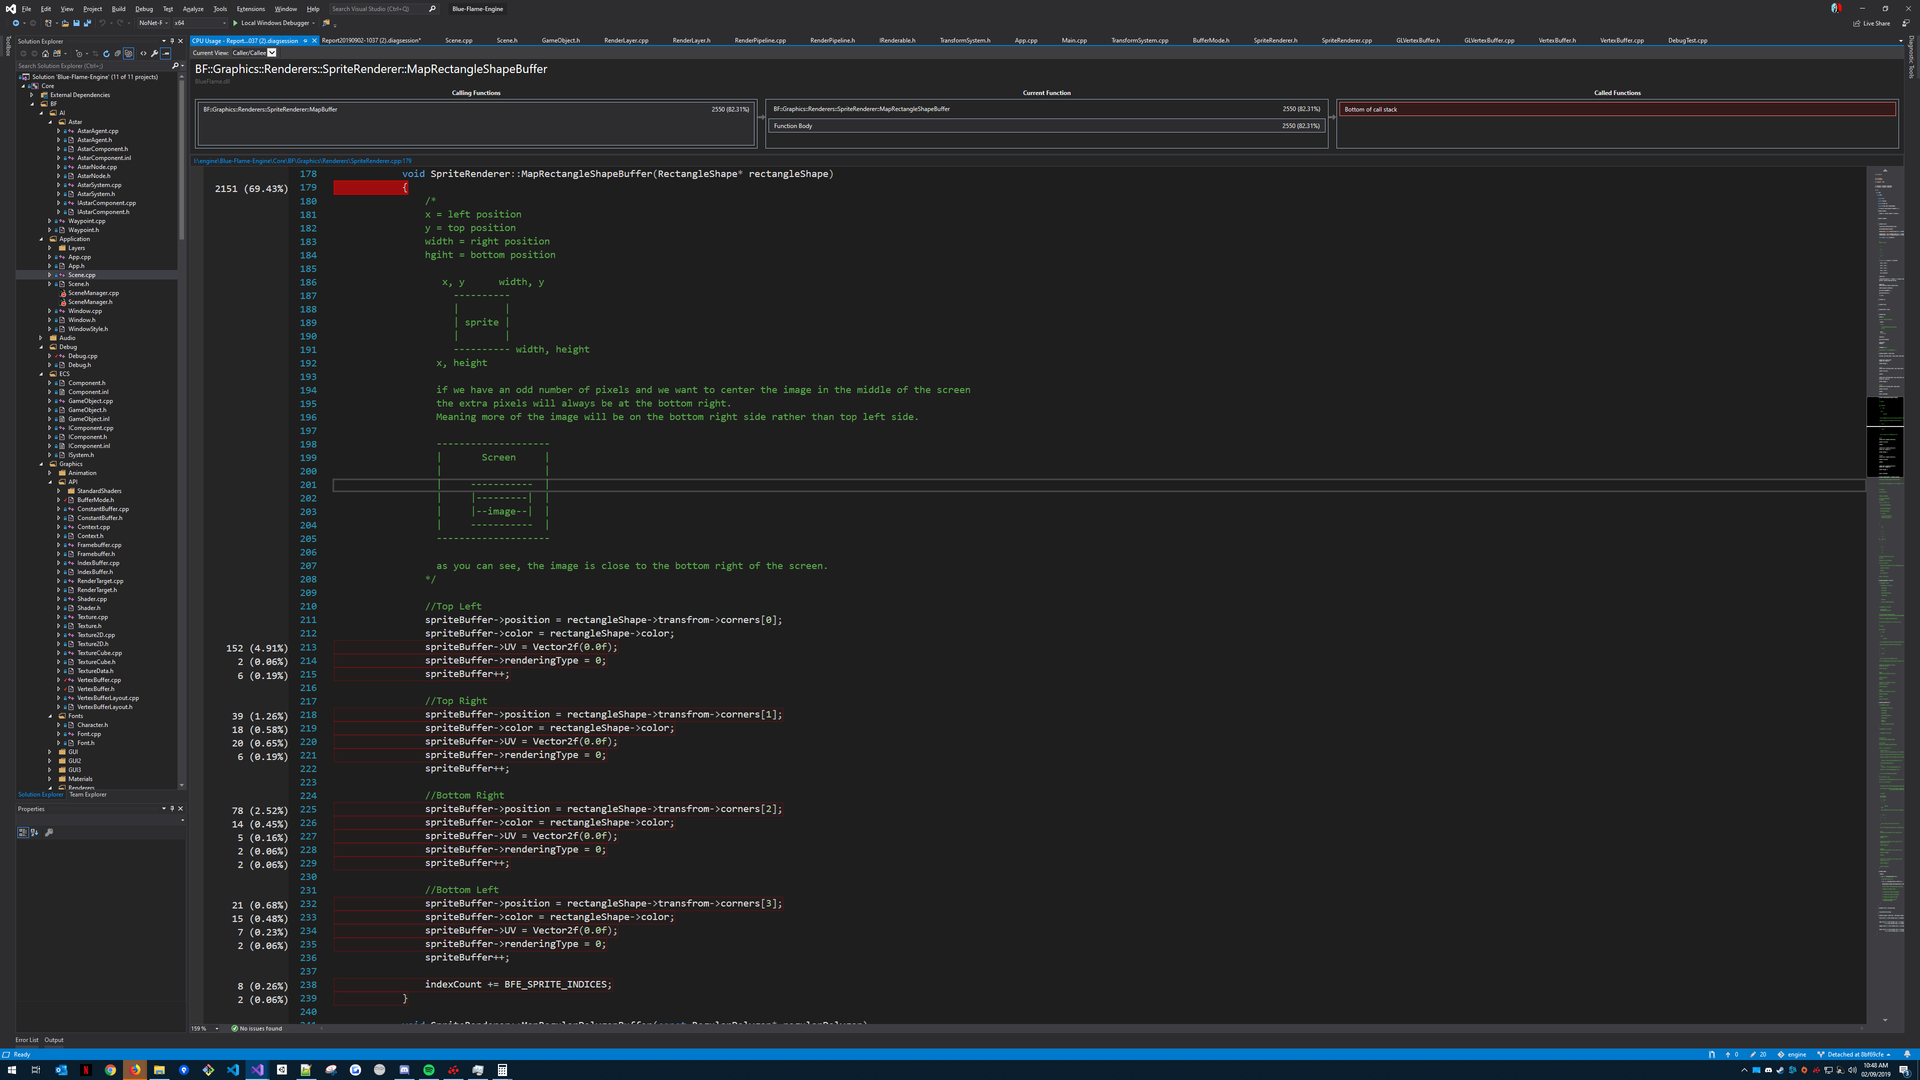
What am I supposed to do with the information that my CPU is spending 69% of its time on the opening curly brace??

My render loop is simple enough and it looks like this


#define BFE_MAX_SPRITES     1000000
#define BFE_SPRITE_VERTICES 4
#define	BFE_SPRITE_INDICES  6
#define BFE_VERTICES_SIZE	BFE_MAX_SPRITES * BFE_SPRITE_VERTICES
#define BFE_INDICES_SIZE	BFE_MAX_SPRITES * BFE_SPRITE_INDICES

void SpriteRenderer::Initialize()
{
	BF::Engine::GetContext().SetPrimitiveType(PrimitiveType::Triangles);

	shader.LoadStandardShader(ShaderType::SpriteRenderer);

	vertexBufferLayout.Push(0, "POSITION", VertexBufferLayout::DataType::Float2, sizeof(SpriteBuffer), 0);
	vertexBufferLayout.Push(1, "COLOR", VertexBufferLayout::DataType::Float4, sizeof(SpriteBuffer), sizeof(Vector2f));
	vertexBufferLayout.Push(2, "TEXCOORD", VertexBufferLayout::DataType::Float2, sizeof(SpriteBuffer), sizeof(Vector2f) + sizeof(Color));
	vertexBufferLayout.Push(3, "RENDERINGTYPE", VertexBufferLayout::DataType::Float, sizeof(SpriteBuffer), sizeof(Vector2f) + sizeof(Color) + sizeof(Vector2f));

	unsigned int* indices = new unsigned int[BFE_INDICES_SIZE];
	int index = 0;

	/*
	Winding order is clock-wise.
	0 -> 1 -> 2 ---> 2 -> 3 -> 0

		0      1
		 ______
		|\     |
		| \    |
		|  \   |
		|   \  |
		|    \ |
		|_____\|
		3      2
	*/

	for (unsigned int i = 0; i < BFE_INDICES_SIZE; i += BFE_SPRITE_INDICES)
	{
		indices[i + 0] = index + 0;
		indices[i + 1] = index + 1;
		indices[i + 2] = index + 2;

		indices[i + 3] = index + 2;
		indices[i + 4] = index + 3;
		indices[i + 5] = index + 0;

		index += BFE_SPRITE_VERTICES;
	}

	vertexBuffer.Create();
	vertexBuffer.Allocate(BFE_VERTICES_SIZE * sizeof(SpriteBuffer), nullptr, BufferMode::PersistentMapping);
	ogSpriteBuffer = (SpriteBuffer*)vertexBuffer.MapPersistentStream();
	spriteBuffer = ogSpriteBuffer;

	indexBuffer.Create();
	indexBuffer.SetBuffer(indices, BFE_INDICES_SIZE, BufferMode::StaticDraw);

	vertexBuffer.SetLayout(shader, &vertexBufferLayout);

	Engine::GetContext().EnableDepthBuffer(false);
	Engine::GetContext().EnableBlending(true);
	Engine::GetContext().EnableScissor(true);

	delete[] indices;
}
			
void SpriteRenderer::Render()
{
	totalDrawCalls = 0;
	shader.Bind();

	MapBuffer();

	vertexBuffer.Bind();
	indexBuffer.Bind();
	Engine::GetContext().Draw(indexCount);
	indexBuffer.Unbind();
	vertexBuffer.Unbind();
	totalDrawCalls++;

	indexCount = 0;
	currentBoundTexture = nullptr;
	spriteBuffer = ogSpriteBuffer;
}


void SpriteRenderer::MapBuffer()
{
	if (submitSprite)
	{
		for (size_t i = 0; i < renderLayerManager.renderLayers.size(); i++)
		{
			for (size_t j = 0; j < renderLayerManager.renderLayers[i]->renderables.size(); j++)
			{
				MapRectangleShapeBuffer((RectangleShape*)renderLayerManager.renderLayers[i]->renderables[j]);
			}
		}
	}
}

void SpriteRenderer::MapRectangleShapeBuffer(RectangleShape* rectangleShape)
{
	//Top Left
	spriteBuffer->position = rectangleShape->transfrom->corners[0];
	spriteBuffer->color = rectangleShape->color;
	spriteBuffer->UV = Vector2f(0.0f);
	spriteBuffer->renderingType = 0;
	spriteBuffer++;

	//Top Right
	spriteBuffer->position = rectangleShape->transfrom->corners[1];
	spriteBuffer->color = rectangleShape->color;
	spriteBuffer->UV = Vector2f(0.0f);
	spriteBuffer->renderingType = 0;
	spriteBuffer++;

	//Bottom Right
	spriteBuffer->position = rectangleShape->transfrom->corners[2];
	spriteBuffer->color = rectangleShape->color;
	spriteBuffer->UV = Vector2f(0.0f);
	spriteBuffer->renderingType = 0;
	spriteBuffer++;

	//Bottom Left
	spriteBuffer->position = rectangleShape->transfrom->corners[3];
	spriteBuffer->color = rectangleShape->color;
	spriteBuffer->UV = Vector2f(0.0f);
	spriteBuffer->renderingType = 0;
	spriteBuffer++;

	indexCount += BFE_SPRITE_INDICES;
}


I don't know where to go from here

Advertisement

Question: What is the reason that you have to do some "parallel computation friendly" looks-like work on the CPU? Is there any necessary simulation needed to be run on the CPU before you drawing your sprites? Do you have to use different vertex positions and colors for each sprite instance?

If you just want to draw one topologically identical mesh with multiple instances on the screen, I highly recommend you spend some time to investigate "Instance Rendering" and "Indirect Rendering" techniques. Both of them are intended to solve CPU-GPU draw-call related bottlenecks. It's better just create one quad-shape mesh instance as the billboard, then use multiple transformation matrices to draw different instances if your case was such kind of.

Also, I highly recommend you try to re-design your rendering pipeline to something like "Gathering per-object data on CPU side->Upload a large buffer to GPU once->Bind GPU data with range and offset in the large buffer->Issue draw call", leave some of the parallel work to GPU rather than craft them by your hand on CPU.

1 hour ago, zhangdoa said:

Question: What is the reason that you have to do some "parallel computation friendly" looks-like work on the CPU? Is there any necessary simulation needed to be run on the CPU before you drawing your sprites? Do you have to use different vertex positions and colors for each sprite instance?


Yes, each sprite is unique, each has its own position, color, and texture.


1 hour ago, zhangdoa said:

Question: What is the reason that you have to do some "parallel computation friendly" looks-like work on the CPU? Is there any necessary simulation needed to be run on the CPU before you drawing your sprites? Do you have to use different vertex positions and colors for each sprite instance?

If you just want to draw one topologically identical mesh with multiple instances on the screen, I highly recommend you spend some time to investigate "Instance Rendering" and "Indirect Rendering" techniques. Both of them are intended to solve CPU-GPU draw-call related bottlenecks. It's better just create one quad-shape mesh instance as the billboard, then use multiple transformation matrices to draw different instances if your case was such kind of.


The issue with Instance Rendering is, as far as I know, all objects have to have the same mesh, and texture. Either way, I will implement Instance Rendering at some point. But for now, I just don't understand why the CPU takes such a long time to prepare the 1mill sprites.


2 hours ago, zhangdoa said:

Also, I highly recommend you try to re-design your rendering pipeline to something like "Gathering per-object data on CPU side->Upload a large buffer to GPU once->Bind GPU data with range and offset in the large buffer->Issue draw call", leave some of the parallel work to GPU rather than craft them by your hand on CPU.


This is basically what I am doing. I do a single draw call for all 1 million sprites. I map a big buffer that holds all the vertices for all the sprites and I modify them on the CPU using persistent buffer mapping.


I found this blog post about the subject, and this guy was able to render 1 million quads at 60 frames with persistent buffer mapping. So I must be doing something wrong, which I don't understand. The profiler is no help.

CPU related questions: How's about the cost of MapBuffer() in Debug build? What's the difference between the different compiler optimization level? Do you need to consider about to optimize the O(m*n) for-loop? Do you have to submit the data of every single sprite every frame? Could you identify and optimize out any unnecessary temporary variables like the return value of std::vector<T>::size(), or any unnecessary and expensive copy construction?

GPU related questions: What's the buffer usage pattern (GL_STATIC_DRAW/etc) you specified when create and upload the vertex buffer? What's the mapping flag (GL_MAP_PERSISTENT_BIT/etc) you specified when map the vertex buffer? How do you handle the CPU-GPU synchronization between CPU-write operation and GPU-read operation? Is there any double buffering/triple buffering you've implemented? 

And could you share the blog post you're referencing to?

I haven't done this myself yet (apart from one or two tutorials), but i'd look into particle systems (instanced rendering to the rescue), i think you can easily get a much higher frame rate than you have now; with 4 static vertices / 6 indices.

In instanced rendering you have the instance id to variate the theme, e.g. lookup individual data from a uniform buffer object.

Also, one million quads are difficult to display on a 2k or even 4k monitor. Would there be a possibility to do some preselection ?


Edit:

The super bible has an example for rendering 1 million grass blades at high frame rate. They write the individual data (changes in the geometry, orientation, colour, texture) of each grass blade into textures instead of a large buffers and use the instance id in the shader to look up the individual data from the textures. One can even make it wave and sway in the wind. Maybe that's where you can look up more ...

A large number of profiling samples on an opening brace like that points to a stall of some kind. In this case there seems to be a lot of pointer chasing going on here:


MapRectangleShapeBuffer((RectangleShape*)renderLayerManager.renderLayers[i]->renderables[j]);

From the cast it looks like renderables is something like std::vector<Renderable*>, so for each iteration you're probably loading from main memory instead of from cache. And then it will also re-load the RenderLayer and the renderables vector/array again and again, unless the compiler can prove that nothing could possibly change them between iterations.

To fix it: Store your "Renderables" by value, If you have different types of Renderables keep them in seperate vectors. Your for loop should look something like this:


for(const auto& renderLayer : renderLayerManager.renderLayers)
{
	for(const auto& sprite : renderLayer.sprites) //sprites is std::vector<RectangleShape>
	{
		MapRectangleShapeBuffer(sprite);
	}
}


It's good you've started your optimziation by profiling, there are so many that just guess.

But I'd suggest you to use a better profiler, you can try CodeXL or VTune, both will tell you the cost of every module and every assembly line. Both offer you sample based profiling or hierarchical, hence you can find expensive lines (e.g. some cache misses that might cause all the trouble) or a global overview.


47 minutes ago, ProfL said:

It's good you've started your optimziation by profiling, there are so many that just guess.

Well, if a different algorithm/technique than the one used is 10 times faster by itself then the best profiler won't help ... it says the mapped buffer costs time, which is not surprising .... just sayin', no offence.

well, if the 10 times faster algorithm gets implemented before profiling first and it turns out to make no difference... you should have used a profiler first.

just replying.


and yes, roughly his MapRectangleShapeBuffer function is problematic, but why exactly? With a good profiler, you can get information on whether your L1 or L2 cache runs misses, whether you are limited on memory write (e.g. due to PCIe if you write persistent buffers), whether you might accidentally read from unmapped memory, or get write cache misses. And there are many more possible reasons.

It's better to have a tool report the issue and fix it, than to stumble blindly in the garden of 100 obvious reasons until you fix the right one.

I don't want to fight. Being too deep in details can block the view and cost time. My intention was to simply suggest a different technique for communicating data between app and glsl, different than a huge mapped buffer that must be mapped, written to, and handed back and a technique that can be combined with instancing. A profiler does not report the issue of being on a dead end track if one is on such a track, or does it ?

The suggested technique with textures runs fast, maybe 100s of frames per second (guessing here ;-)) and it appears to me (guessing again) that it offers the flexibility that OP needs.

But this is only a suggestion, i don't pretend to be right and maybe i don't even have the complete overview and there may be more than one solution to the problem of having too low a frame rate ?.

Edit: using a texture for parameters instead of a buffer offers additional flexibility, actually. One can make the texture smaller than the render area and read values with linear filtering, thus mimicking smooth transitions between parameter changes. But i do not know if this applies here, i don't know enough about the original task.


This topic is closed to new replies.

Advertisement