As a software/game developer, you usually want more and more... of everything actually! More pixels, more triangles, more FPS, more objects on the screen, bots, monsters. Unfortunately you don't have endless resources and you end up with some compromises. The optimization process can help in the reduction of performance bottlenecks and it may free some available powers hidden in the code.
Optimization shouldn't be based on random guesses: "oh, I think, if I rewrite this code to SIMD, the game will run a bit faster". How do you know that "this code" makes some real performance problems? Is investing there a good option? Will it pay off? It would be nice to have some clear guide, a direction.
In order to get some better understanding on what to improve, you need to detect a base line of the system/game. In other words, you need to measure the current state of the system and find hot spots and bottlenecks. Then think about factors you would like to improve... and then... start optimizing the code! Such a process might not be perfect, but at least you will minimize potential errors and maximize the outcome.
Of course, the process will not be finished with only one iteration. Every time you make a change, the process starts from the beginning. Do one small step at a time. Iteratively.
At the end your game/app should still work (without new bugs, hopefully) and it should run X times faster. The factor X, can be even measured accurately, if you do the optimization right.
The Software Optimization Process
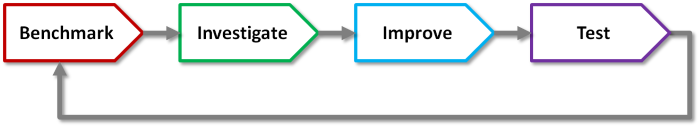
According to this and this book, the process should look like this:
- Benchmark
- Find hot spots and bottlenecks
- Improve
- Test
- Go back
The whole process should not start after the whole implementation (when usually there is no time to do it), but should be executed during the project's time. In case of our particle system I tried to think about possible improvements up front.
1. The benchmark
Having a good benchmark is a crucial thing. If you do it wrong then the whole optimization process can be even a waste of time.
From The Software Optimization Cookbook book:
The benchmark is the program or process used to:
- Objectively evaluate the performance of an application
- Provide repeatable application behavior for use with performance analysis tools.
The core and required attributes:
- Repeatable - gives the same results every time you run it.
- Representative - uses large portion of the main application's use cases. It would be pointless if you focus only on a small part of it. For a game such a benchmark could include the most common scene or scene with maximum triangles/objects (that way simpler scenes will also work faster).
- Easy to run - you don't want to spend hours setting up and running the benchmark. A benchmark is definitely harder to make than a unit test, but it would be nice if it runs as fast as possible. Another point is that it should produce easy to read output: for instance FPS report, timing report, simple logs... but not hundreds of lines of messages from internal subsystems.
- Verifiable - make sure the benchmark produces valid and meaningful results.
2. Find hot spots and bottlenecks

When you run your benchmark you will get some output. You can also run profiling tools and get more detailed results of how the application is performing.
But, having data is one, but actually, it is more important to understand it, analyze and have good conclusion. You need to find a problem that blocks the application from running at full speed.
Just to summarize:
- bottleneck - place in the system that makes the whole application slower. Like the weakest element of a chain. For instance, you can have a powerful GPU, but without fast memory bandwidth you will not be able to feed this GPU monster with the data - it will wait.
- hot spot - place in the system that does crucial, intensive job. If you optimize such a module then the whole system should work faster. For instance, if CPU is too hot then maybe offload some work to GPU (if it has some free compute resources available).
This part may be the hardest. In a simple system it is easy to see a problem, but in large-scale software it can be quite tough. Sometimes it can be only one small function, or the whole design, or some algorithm used.
Usually it is better to use a top-down approach. For example:
Your framerate is too low. Measure your CPU/GPU utilization. Then go to CPU or GPU side. If CPU: think about your main subsystems: is this a animation module, AI, physics? Or maybe your driver cannot process so many draw calls? If GPU: vertex or fragment bound... Go down to the details.
3. Improve
Now the fun part! Improve something and the application should work better :)
What you can improve:
- at system level - look at utilization of your whole app. Are any resources idle? (CPU or GPU waiting?) Do you use all the cores?
- at algorithmic level - do you use proper data structures/algorithms? Maybe instead of O(n) solution you can reduce it to O(log n) ?
- at micro level - the 'funniest' part, but do it only when the first two levels are satisfied. If you are sure, that nothing more can be designed better, you need to use some dirty code tricks to make things faster.
One note: Instead of rewriting everything to Assembler use your tools first. Today's compilers are powerful optimizers as well. Another issue here is portability: one trick might not work on another platform.
4. Test
After you make a change test how the system behaves. Did you get 50% of the speed increase? Or maybe it is even slower?
Beside performance testing, please make sure you are not breaking anything! I know that making systems 10% faster is nice, but your boss will not be happy if, thanks to this improvement, you introduce several hard-to-find bugs!
5. Go back

After you are sure everything works even better than before... just run your bechmark and repeat the process. It is better if you make a small, simple change, rather than big, but complex. With smaller moves it is harder to make a mistake. Additionally, it is easy to revert the changes.
Profiling Tools
Main methods:
- custom timers/counters - you can create a separate configuration (based on Release mode) and enable a set of counters or timers. For instance, you can place it in every function in a critical subsystem. You can generate call hierarchy and analyse it further on.
- instrumentation - tool adds special fragments of code to your executable so that it can measure the execution process.
- interception - tool intercepts API calls (for instance OpenGL - glIntercept, or DirectX) and later on analyses such register.
- sampling - tool stops the application at specific intervals and analyses the function stack. This method is usually much lighter than instrumentation.
Below is a list of professional tools that can help:
- Intel(R) VTune(TM) Amplifier
- Visual Studio Profiler
- AMD CodeXL - FREE. AMD created a good, easy to use, profiling tool for CPU and GPU as well. Does the best job when you have also AMD CPU (that I don't have ;/) but for Intel CPU's it will give you at least timing reports.
- ValGrind - runs your app on a virtual machine and can detect various problems: from memory leaks to performance issues.
- GProf - Unix, uses a hybrid of sampling and instrumentation.
- Lots of others... here on wikipedia
Something more
Automate
I probably do not need to write this... but the more you automate the easier your job will be.
This rule applies, nowadays, to almost everything: testing, setup of application, running the application, etc.
Have Fun!
The above process sounds very 'professional' and 'boring'. There is also another factor that plays an important role when optimizing the code: just have fun!
You want to make mistakes, you want to guess what to optimize and you want to learn new things. In the end, you will still get some new experience (even if you optimized a wrong method).
You might not have enough time for this at your day job, but what about some hobby project?
The more experience with the optimization process you have, the faster your code can run.
References
- The Software Optimization Cookbook: High Performance Recipes for IA-32 Platforms, 2nd Edition, Intel Press; 2nd edition (December 2005) - Contains lots of useful information, written in a light way. I've won it on GDC Europe 2011 :)
- Video Game Optimization, by Eric Preisz - another good book, also quite unique in this area. I would like to see the second edition - improved, updated and maybe extended.
- C++ For Game Programmers (Game Development Series)
- Game Coding Complete, Fourth Edition
- Agner`s optimization manuals
- Understanding Profiling Methods @MSDN
- Sampling vs Instrumentation/oktech-profiler docs
- Code and Graphics: particle system implementation series