I might make myself sound old, but nowadays it is ridiculously easy to track down both correctness errors, as well as most performance issues. I recently finished up an application at work that is used for marketing, and the performance was pretty good but not great. I suspected that I was somehow GPU bound, since the framerate dropped more or less proportionally with render target resolution, but I wasn't sure exactly what was the issue. The rendering technique goes something like this:
- Render the scene into a 'silhouette' buffer, used for identifying objects to be highlighted (only geometry that will be outlined gets rendered here)
- Render the scene into the normal render target (whole scene is rendered here).
- Render a full screen quad that samples the silhouette buffer and applies the highlights.
There is a normal desktop mode, and it also has an Oculus Rift mode as well. Of course, the Rift mode decreases performance, since you render the whole sequence twice (once for each eye). I decided I wanted to throw the Visual Studio 2013 performance and diagnostic tools a chance to diagnose what was going on, and I was totally surprised to see that there was a single draw call that was taking substantially more time than the others. If you aren't familiar with the performance tools, you just have to go to "Debug > Performance and Diagnostics" and then check CPU and GPU, and your off to the races.
Due to the multi-pass technique that I was using, I figured it would be either a bandwidth issue, or possibly even a pixel shader limitation - but I totally didn't think it would be primarily from a single draw call... So I then fired up the graphics debugger and took a frame capture, and looked into a similar place in the frame to see if I could trace back which draw call it was. Next I clicked on the "Frame Analysis" tab, where I then found the following graph:
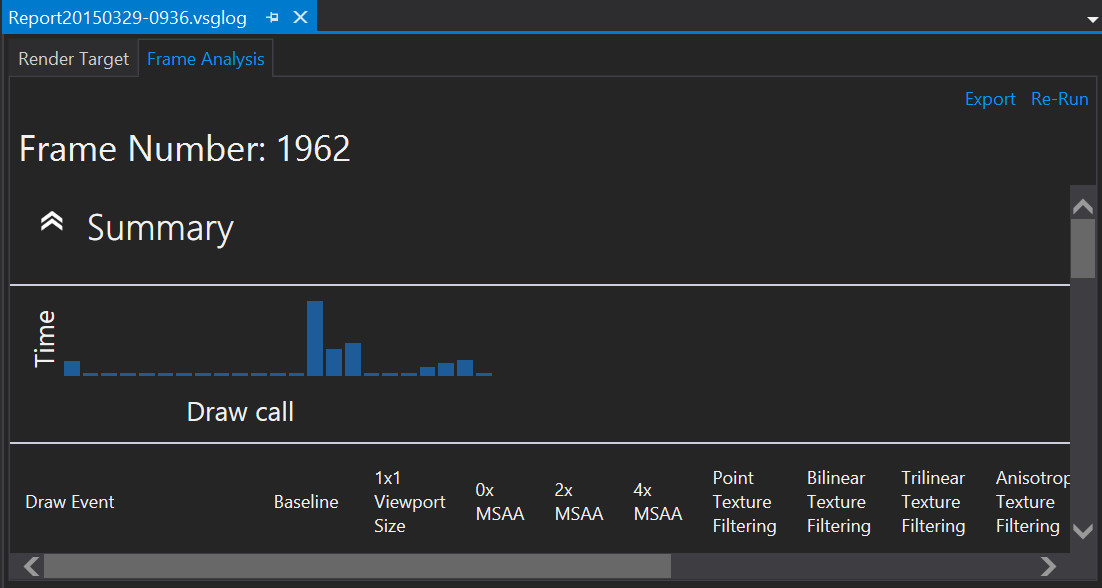
I clicked on the obvious item and tracked it back to a simple OBJ based model, that was rendering a super high resolution mesh instead of the version intended for use in the application. So instead of going down the rabbit hole to figure out if my two pass rendering was the issue, I trivially replaced the model and solved the issue.
So the moral of the story is this: make use of the modern debugging tools that are available in VS2013 and the forthcoming VS2015. They will help you understand your CPU and GPU utilization, find issues, and let you focus on the important, most-bang-for-the-buck tasks!

Sometimes people forget that there are tools out there to help find the exact problem, if not quickly at least help remove a bit of the shadow hiding the issue.
Thanks for the reminder.