This threads been a while, but I just had an update. I did end up following the “Symbol Provider” approach, because making an exe+pdb was not really an option for me.
You effectively have to write a VisualStudio-extension for it, and the documentation is really not helpful with puzzling things together. I found one Visual-Studio repository that implementes the VS-debugger extensions for python, which did help a lot. Anyway, I broke down the process on stackoverflow already, so hhere is the link in case anyone wants to read more: (https://stackoverflow.com/questions/78163674/provide-symbols-to-the-visualstudio-debugger-for-custom-code/78169770#78169770)
I might make an in-depth article at some point, but not sure. Anyway, the results are that I can have custom symbols for both the callstack, as well as the disassembly, which is neat:
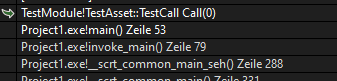
Now compared to changing everything to PDF, I'd say it's less work, once you figure things out. The downside is obviously that it only works for VS, while PDBs are much more portable. The upside is, that I could do much, much more with it. For example, I'm using stack-based coroutines, which requires switching a callstack. This causes VS to lose the connection to the old callstack in the callstack-window. Using those debugger-extensions, I could manually append the old callstack to the window, to provide the actual debugging-experience that I want. I could even go real crazy and implement custom breakpoints, and debugging through my own IL… but I'll probably not be doing it right now. I'm just happy to finally be able to read what's going on while debugging.